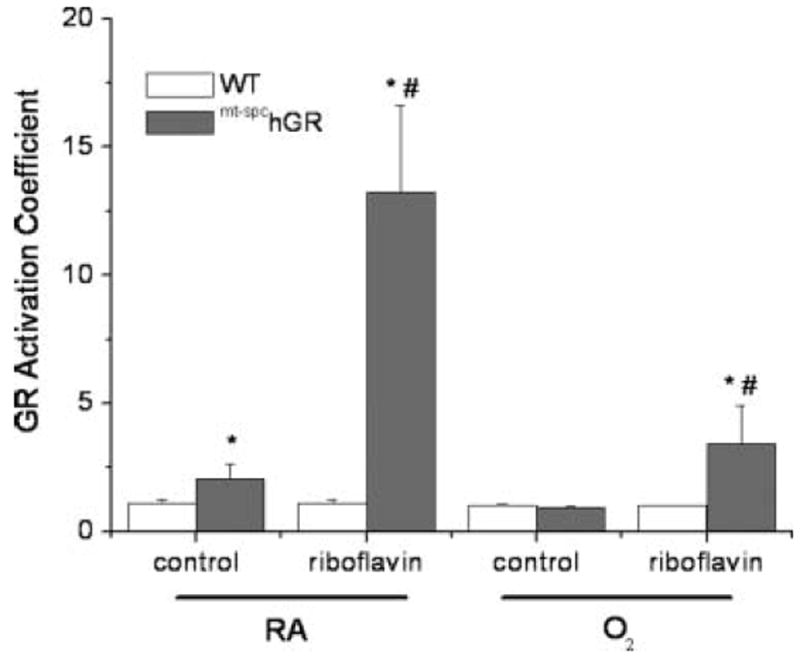
FIGURE 2.

GR activation coefficient. GR activities were also measured in the presence of exogenous FADH (1.25 μM) and the ratios of GR activities with and without ex vivo riboflavin addition were calculated as activation coefficient. Data were analyzed by 3-way ANOVA after natural-log transformation and individual effects of transgene, diet, and exposure, and interactions between transgene and diet, transgene and exposure, and diet and exposure were detected. Two-way ANOVA with exposure as a fixed factor and modified t test post hoc were performed to identify individual differences between groups. *Difference compared to WT, same diet; #difference between diets, same genotype; n = 5–22; P ≤ .05.
