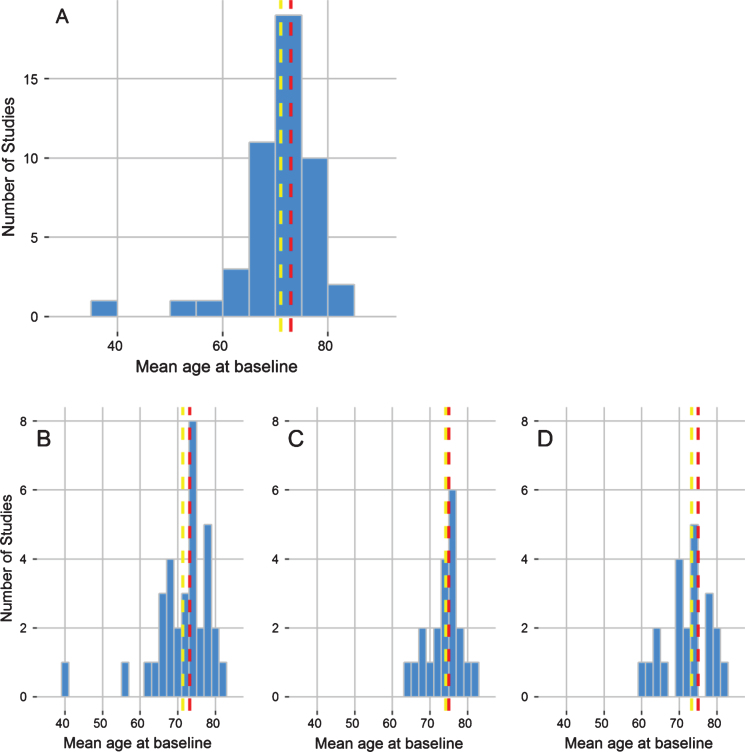
Fig.7.
Age of participants. Histogram outlining the dispersion of mean age of each study population identified by the systematic review. The yellow line corresponds to the overall mean age, taken as the average of each study population, and the red line to the median age of study participants across the systematic review.

