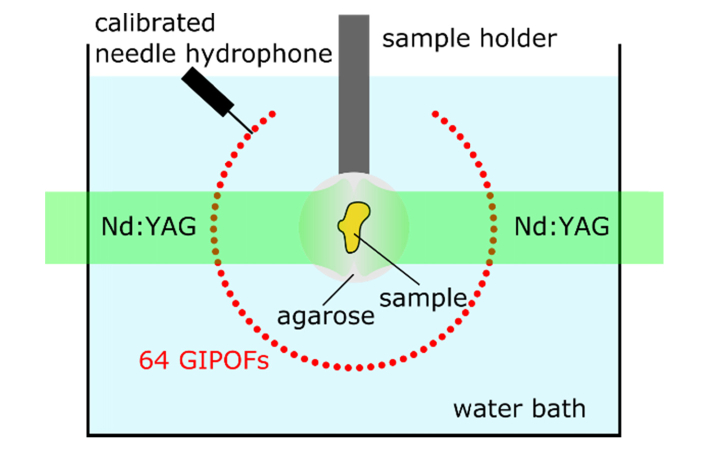
Fig. 2.
Schematic of the performed experiments. In relation to Fig. 1, the schematic shows the cross-section of the GIPOFs. This view is identical to the imaging plane whereupon the photoacoustic signals are projected. The circular GIPOF array covers an angle of 289 degree. The samples are embedded in agarose and held by a sample holder. A pulsed laser beam coming from a frequency doubled Nd:YAG laser is split to illuminate the samples from two sides. To determine the sensitivity of the fiber, a calibrated needle hydrophone is used to quantitatively measure the pressure.

