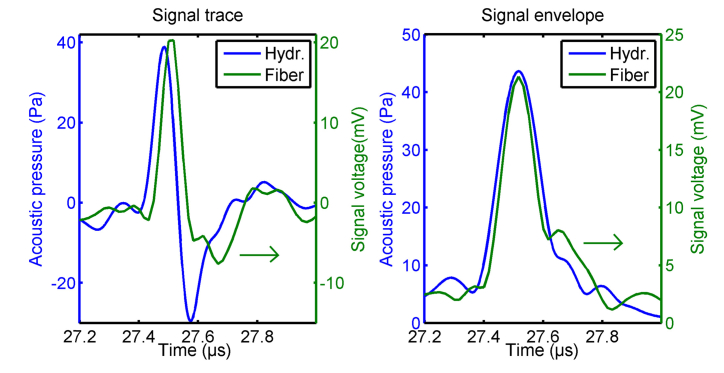
Fig. 3.
Signal traces and envelopes of a photoacoustic wave stemming from a black polyethylene microsphere with a diameter of 200 µm embedded in agarose/Intralipid. The acoustic pressure of the wave is shown by the blue curves (left axis) and was measured with a calibrated needle hydrophone. The green curves (right axis) present the signal voltage acquired by the fiber-optic line detector. The curves were averaged 128-times.

