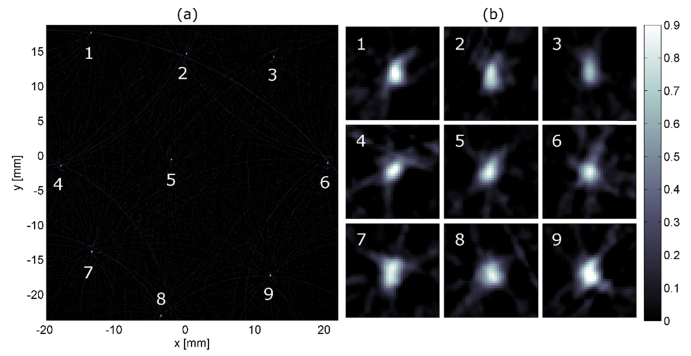
Fig. 6.
(a) shows a single polyethylene microsphere with a diameter of 200 µm embedded in agarose/Intralipid, measured at different locations within an area of 40x40 mm. The image values are normalized to 1. At each position, a measurement of the sphere was performed. The image is a result of a single reconstruction based on summation of the acquired signals. (b) presents zoom-ins at each positon of the sphere. Except for position 6, the images of the sphere deviate slightly from a round shape. However, the point-like shape of the sphere is maintained at every position. In addition, there is no apparent trend indicating an area where the image-quality is significantly reduced.

