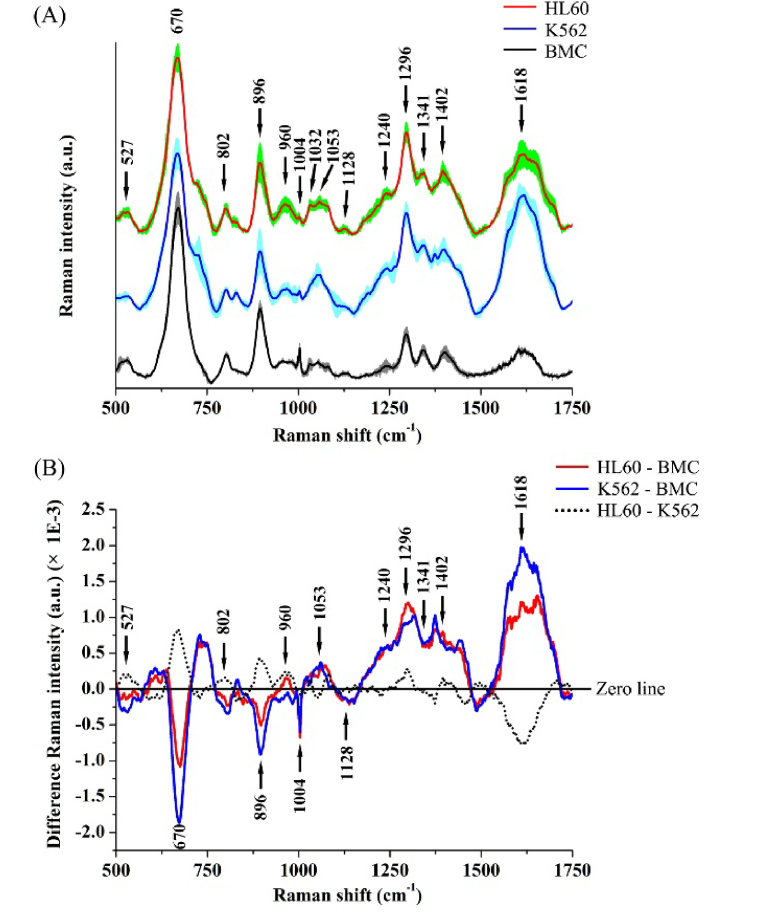
Fig. 3.
(A) Comparison of mean SERS spectra from HL60 cells (n = 60), K562 cells (n = 60) and normal cells (BMC) (n = 60). The shaded areas represent the standard deviations of the means. The mean SERS spectrum (mean ± SD) of each cell group was averaged from the 60 mean SERS spectra in corresponding cell group. Note that the mean SERS spectra of cells are vertically shifted for clarity. (B) Difference spectra calculated from the mean SERS spectra of HL60 cells and BMC (i.e., HL60-BMC) (red line), K562 cells and BMC (blue line), and HL60 cells and K562 cells (black dotted line), respectively.

