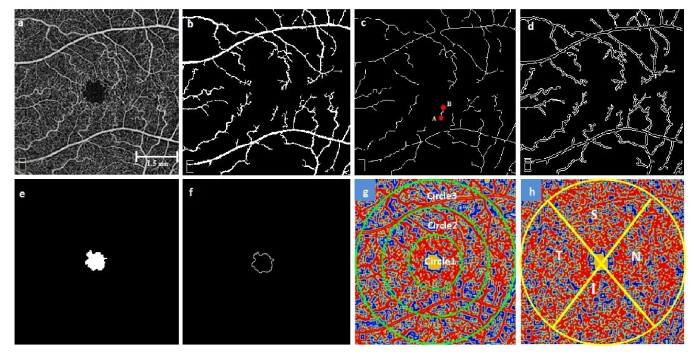
Fig. 4.
Representative images for illustrating the feature extraction (a) OCTA raw image, (b) Segmented large blood vessel map, (c) Skeletonized blood vessels branches with identified endpoints (for a random vessel branch, A and B endpoints are shown with red dots), (d) Vessel perimeter map, (e) Segmented avascular region, (f) FAZ contour, (g,h) Contour maps created with normalized values of local fractal dimension in superficial and deep layers respectively. (g) Circular zones of diameter 2, 4 and 6mm, (h) Nasal, Superior, Temporal and Inferior regions.

