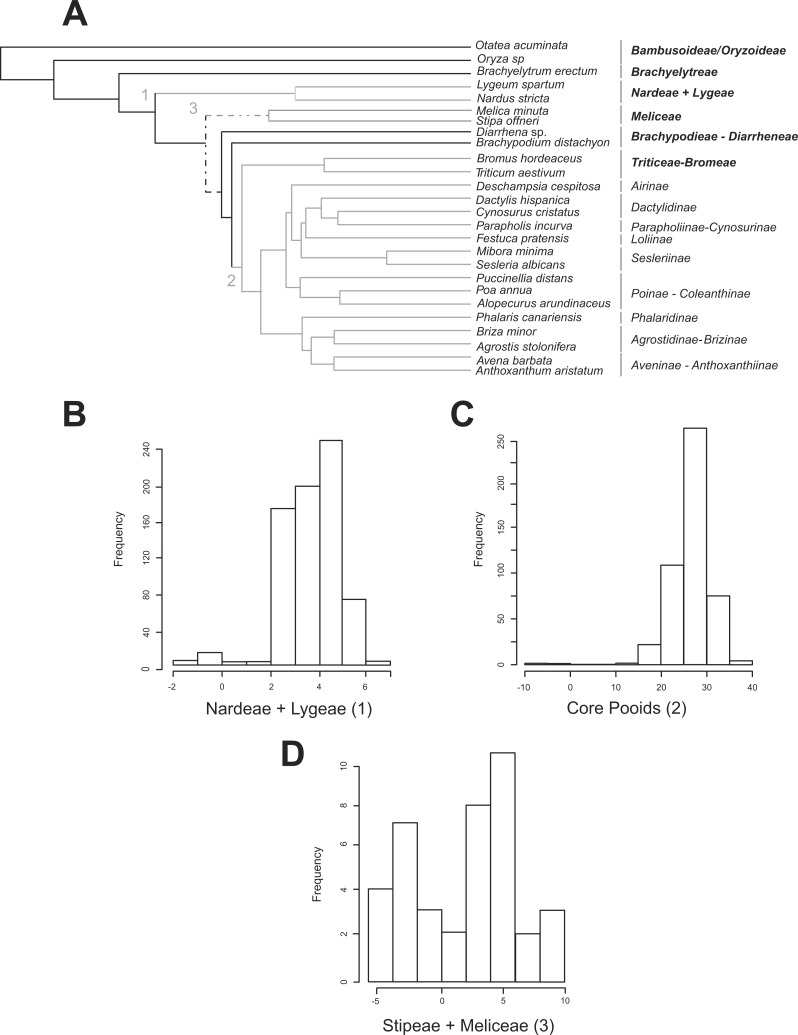
Figure 2. Shifts in diversification detected for the Pooideae using the MEDUSA approach.
(A) Pruned (26 terminals) ultrametric Bayesian consensus tree obtained with BEAST (for details see ‘Materials and Methods’). Gray branches represent significant shifts from the background rate as estimated with the algorithm MEDUSA using 500 diversity data sets obtained from Soreng et al. (2015; for details see ‘Materials and Methods’). Shift numbers are indicated on branches: 1, Nardeae and Lygeae; 2, Core pooids; 3, Meliceae + Stipeae. Numbers as in Fig. 4. Dashed lines represent branches with support below 0.8 PPS. (B–D) Histograms showing the diversification rate analysis conducted with MEDUSA using 500 random Bayesian trees and the diversity data set based on Soreng et al. (2015; for details see ‘Materials and Methods’). Each histogram represents a significant shift in diversification rates. B, Nardeae + Lygeae; C, Core pooids; D, Stipeae + Meliceae. The X-axis represents the amount of change in the AIC value. The Y-axis represents the frequency of the rate shift (number of trees where the change is registered). Names of lineages correspond to the most updated tribal classification of the Pooideae (Soreng et al., 2015). Shift numbers are indicated in the histograms.

