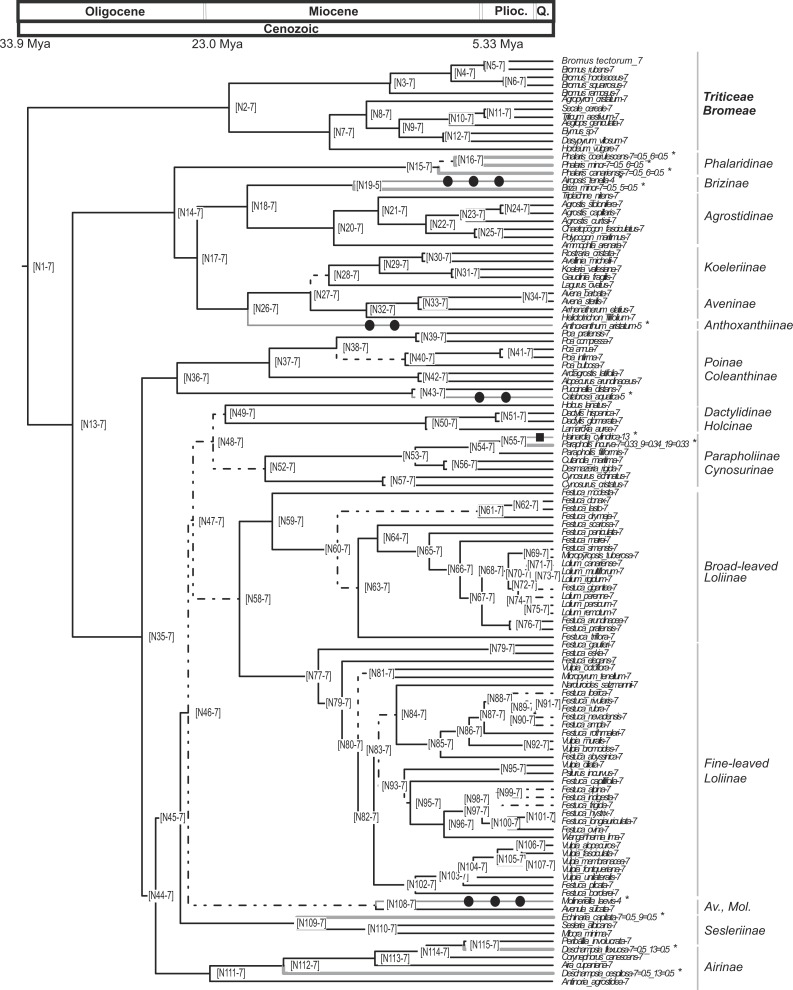
Figure 3. Pruned ultrametric MCC tree produced with BEAST.
Pruned ultrametric MCC tree produced with BEAST (for details see ‘Materials and Methods’). Gray thin branches represent significant changes in haploid chromosome number from the background value n = 7 detected using CHROMEVOL. Affected terminals are indicated with an asterisk. Filled square, transition in base number; filled circle, haploid chromosome number transition based on single chromosome loss. Dashed lines represent branches with PPS < 0.9. Thick gray lines represent events not accounted for in the simulation. Plioc, Pliocene. Q, Quaternary.

