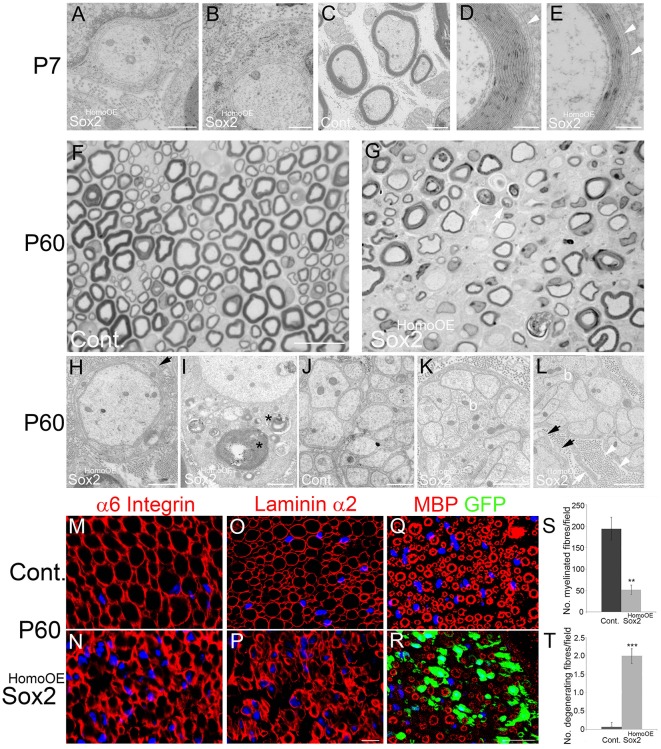
Fig. 4.
Morphology of P7 and P60 control and Sox2HomoOE nerves. (A-E) P7 sciatic nerves from control (C) and Sox2HomoOE animals (A,B,D,E). Whereas control nerve SCs have formed proper myelin (C), in Sox2HomoOE nerves most SCs are stalled in the 1:1 stage (A,B). (D,E) Where Sox2-overexpressing SCs do form myelin, they often show non-compaction of outer myelin layers (white arrowheads). Scale bars: 500 nm in A,B; 2 µm in C; 200 nm in D,E. (F,G) Semi-thin sections of P60 control (F) and Sox2HomoOE (G) nerves; arrows in G indicate possible axonal loss and demyelination. Scale bar: 20 µm. (H-L) P60 control (J) and Sox2HomoOE (H,I,K,L) nerves. At P60, most axons in Sox2HomoOE nerves are amyelinated and surrounded by redundant SC basal lamina (black arrows in H and L), and several SCs show myelin debris in the cytoplasm (asterisks in I). Remak bundles, which in control nerves show proper SC cytoplasm separating axons (J), show bundles of axons touching each other (‘b’ in K and L) and aberrant SC processes (white arrow in L), the basal lamina of which forms collagen pockets (white arrowheads in L). Scale bars: 1 µm in H-L. (M-R) P60 control (M,O,Q) and Sox2HomoOE (N,P,R) nerve sections immunolabelled with α6 integrin (M,N), laminin α2 (O,P) and myelin basic protein (MBP)/GFP (Q,R). Scale bars: 5 µm in M-P; 25 µm in Q,R. (S,T) Quantification of myelinated (S) and degenerating (T) fibres per field in P60 control and Sox2HomoOE nerves. Two-sided two-sample Student's t-test; data from n=3 mice of each genotype; **P<0.01, ***P<0.005.

