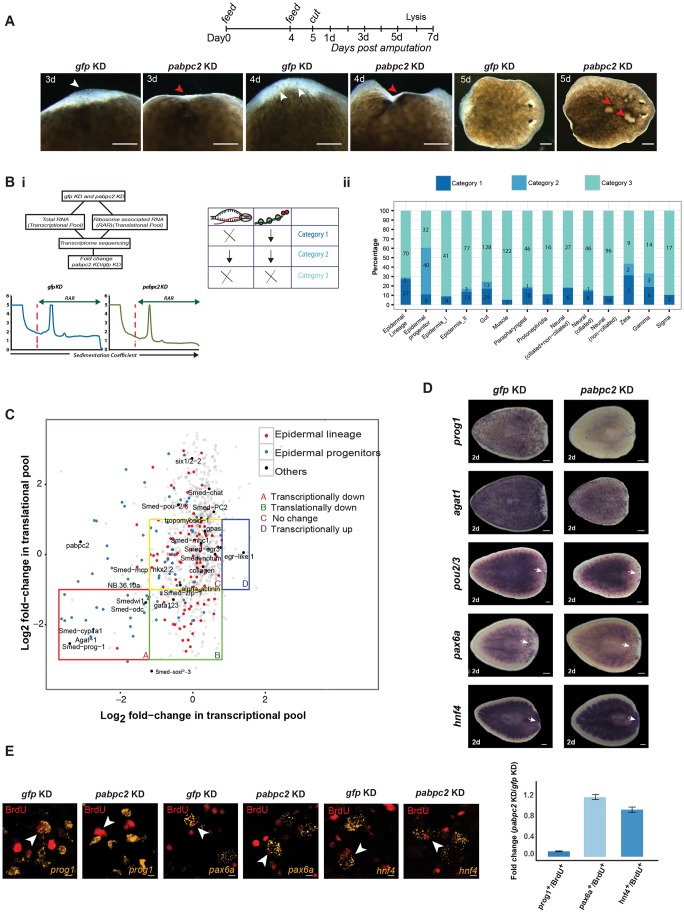
Fig. 2.
PABPC2 regulates epidermal lineage transcripts. (A) Timeline showing RNAi feed schedule. Images were taken at 3, 4 and 5 dpa after dsRNA treatment. White arrowheads show normal blastema in control animals. Red arrowheads highlight the defective blastema and the lesions in knockdown animals (100/100). Scale bars: 200 μm. (Bi) The method used to identify the transcripts associated with the ribosome and cellular transcripts in the gfp and pabpc2 knockdown animals. ×, no change; ↓, decrease. (Bii) Stack bar depicting number and percentage of transcripts that belong to different categories across various cell types. Fold change was calculated by taking the ratio of the normalized number of transcripts between pabpc2 and gfp knockdown animals. (C) Scatter plot of fold-change values (PABPC/GFP) showing the distribution of transcripts between the transcriptional and translational pool. Transcripts from different categories are marked as four quadrants A, B, C and D. Transcripts that belong to epidermal lineage and epidermal progenitors are highlighted in red and blue, respectively. Some well-known markers belonging to different cell types and wound-healing genes are labeled in the scatter plot. (D) Whole-mount in situ hybridization using different progenitor markers such as prog1, agat1, pou2/3, hnf4 and pax6a at 2 dpa in gfp and pabpc2 knockdown animals. Epidermal progenitors (prog1 and agat1) showed a significant reduction in the expression upon pabpc2 knockdown, unlike other progenitors (hnf4, pax6a and pou2/3). White arrows indicate staining in the blastema. Scale bars: 200 μm (n=10). (E) Confocal images showing BrdU and progenitor (prog1, hnf4 and pax6a)-positive cells in gfp and pabpc2 knockdown animals. BrdU was injected post-2nd feed and animals were fixed 2 days post-BrdU injections. Equal numbers of BrdU cells were counted in gfp and pabpc2 knockdown animals and the numbers of colocalized cells were counted for each progenitor. The histogram depicts the fold change in colocalized cells in gfp and pabpc2 knockdown animals. Error bars were calculated from biological replicates. Yellow arrows indicate co-labeled cells. Scale bars: 5 μm. n=6. See also Fig. S2.

