Fig. 1.
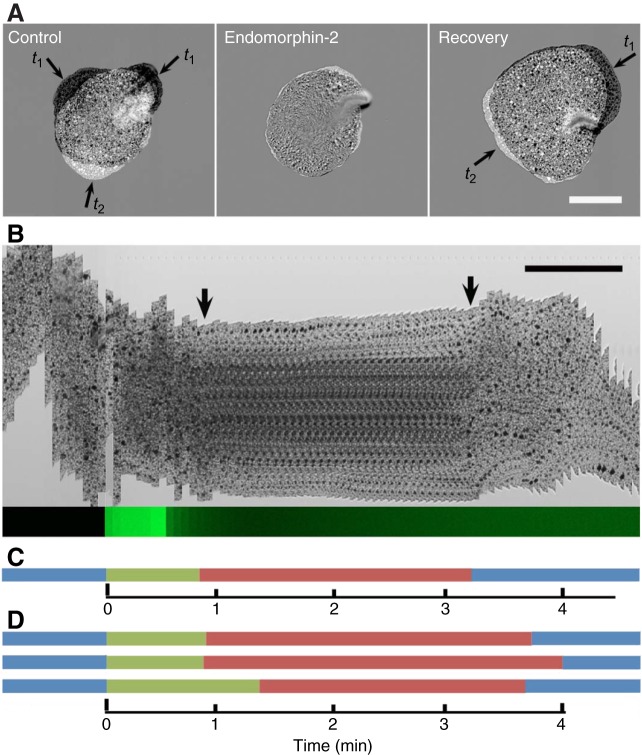
Endormorphin-2 and Trichoplax endomorphin-like peptides (TaELPs) elicit pauses in gliding. (A) Extent of movement of an animal before (Control), ∼1.5 min after (Endomorphin-2) and 4 min after (Recovery) application of a 30 s pulse of 5 μmol l−1 endomorphin-2 from a pipette positioned ∼1 mm above the animal. Subtracted pairs of transmitted light images captured with a confocal microscope are shown. Each image illustrates the silhouettes of the animal at two time points (t1 and t2), 19 s apart. Areas around the edge that moved during the 19 s interval appear light or dark, while areas that were stationary match the background gray level. The animal was almost completely stationary 1.5 min after the pulse but had resumed gliding by 4 min. (B) The time courses of pausing and recovery and of the pulse are illustrated by kymographs from transmitted light (top) and fluorescence (bottom) images. The transmitted light kymograph shows sequential images of a narrow (16 µm) region along the vertical axis of the animal captured at 4 s intervals. At the beginning of the sequence, the animal was moving, as evident from the vertical displacement of its edges and dark intracellular inclusions in its interior. Approximately 1 min after the start of the pulse, the animal ceased moving, both its edges and intracellular inclusions becoming mostly stationary (arrows indicate the beginning and end of the pause). The time course of release of peptide was calibrated by monitoring release of a fluorescent dye from the pipette in a separate experiment, depicted by the narrow green kymograph at the bottom. The fluorescence intensity remained high for the 30 s duration of the pulse and dropped rapidly after termination of the pulse. Scale bars in A and B, 200 µm. (C) Gliding (blue) and pausing (red) are plotted in a corresponding bar plot. The green bar indicates the delay between the onset of application of the peptide and the subsequent pause. (D) Three similar bar plots showing effects of release onto three different animals of 5 μmol l−1 TaELP.

