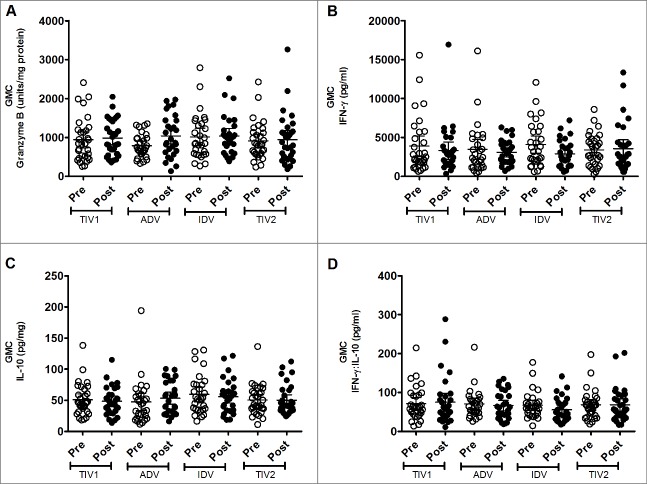
Figure 2.
Geometric mean concentrations (GMC) of effectors produced by stimulated fresh PBMCs. PBMCs from pre- (light circles) and post-immunized (dark circles) elderly individuals were stimulated with live A/H3N2 influenza virus. Shown are individual levels and GMCs (horizontal bars) in PBMC lysates of GrB (panel A), IFN-γ (panel B) and IL-10 (panel C) and IFN-γ:IL-10 ratio (panel D) in PBMC culture supernants. Paired t-tests were used to compare GMC of pre- and post-vaccinated groups of individuals and one-way ANOVA was used for cross-vaccine comparisons. All comparisions appeared non-significant. TIV1 = subunit vaccine; ADV = subunit vaccine with MF59 adjuvant; TIV2 = split-virus vaccine; IDV = split-virus vaccine given intradermally.

