
Figure 3.
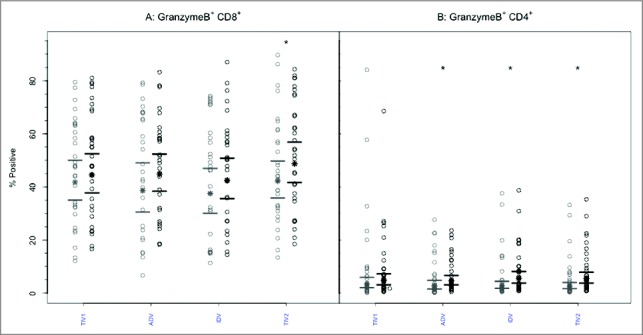
CD8+ and CD4+ T-cells mediated GrB responses to 4 commercial vaccines. PBMCs from pre- (light circles) and post-immunized (dark circles) elderly individuals were stimulated with live A/H3N2 influenza virus. Phenotype of the stimulated T-cells was measured by flow cytometry and percentage of CD8+ (panel A) and CD4+ T-cells (panel B) expressing GrB was then measured by immunocytochemistry (ICC). Individual values are expressed as percentages of CD4+ and CD8+ cells expressing GrB, while the group geometric mean percentage is denoted with a bold star (*). Horizontal bars represent 95% confidence intervals. Paired t-tests were used to compare means of pre- and post-vaccinated individuals in each group (*significant difference p ≤ 0.005). In panel A, only TIV2 induced an increase in GrB+ CD8+ T-cells while in panel B, ADV, IDV and TIV2 vaccines induced significant increases in proportions of GrB+CD4+ T-cells after vaccination. TIV1 = subunit vaccine; ADV = subunit vaccine with MF59 adjuvant; TIV2 = split-virus vaccine; IDV = split-virus vaccine given intradermally.