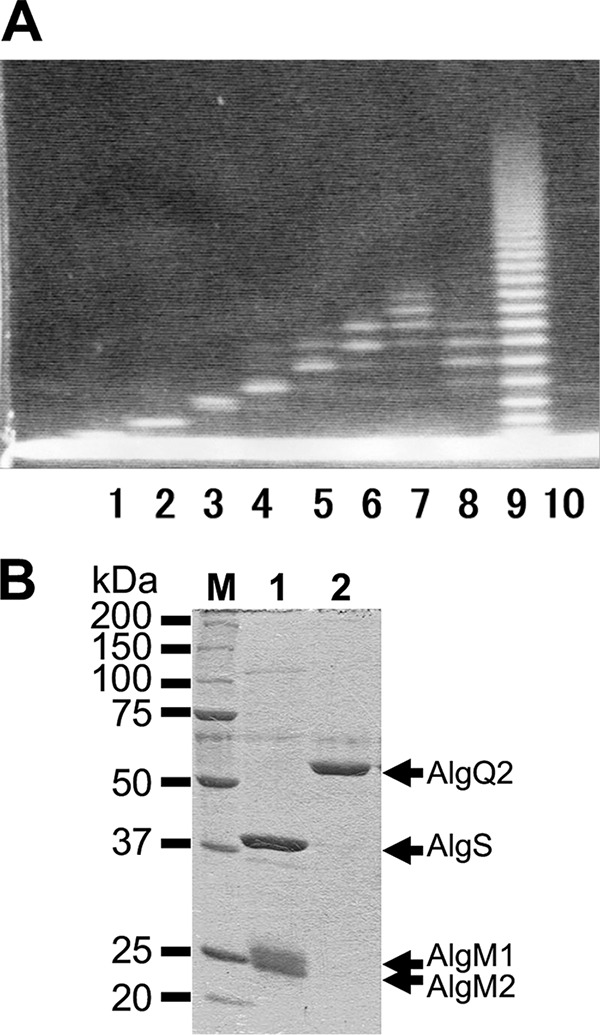
Figure 1.

Electrophoretic profiles of oligosaccharides and proteins. A, FACE profiles of alginate oligosaccharides. Lane 1, Δ2M; lane 2, Δ3M; lane 3, Δ4M; lane 4, Δ5M; lane 5, Δ6M; lane 6, Δ7-8M; lane 7, 7–10M; lane 8, 6–8M; lane 9, saturated M oligosaccharides before purification; lane 10, negative control treated with 8-amino-1,3,6-naphthalenetrisulfonic acid in the absence of oligosaccharide. B, SDS-PAGE profiles of AlgM1M2SS (lane 1) and AlgQ2 (lane 2). Three protein bands indicated by arrows correspond to AlgS, AlgM1, and AlgM2 in the purified AlgM1M2SS (lane 1). An arrow indicates the position of AlgQ2 (lane 2). M, mass.
