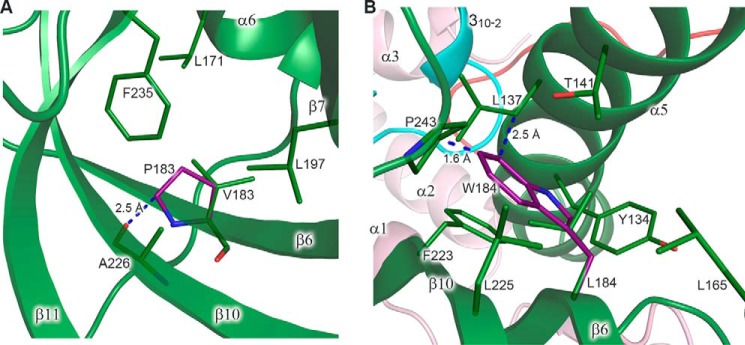
Figure 11.
Modeling of the amino acid changes inducing steric hindrance. A, close-up view of a hydrophobic pocket with modeled proline in place of Val183. Val183 makes two main-chain–to–main-chain hydrogen bonds with Ala226 (not shown). Leu171, Val183, Leu197, Ala226, and Phe235 of p59 correspond to Leu274, Leu284, Leu298, Val328, and Phe339 of Dpb2, respectively. B, close-up view of a hydrophobic pocket with modeled tryptophan in place of Leu184. In the shown conformation, tryptophan clashes with the side chains of Pro243 and Leu137. Tyr134, Leu137, Thr141, Leu165, Leu184, Phe223, Leu225, and Pro243 of p59 correspond to Tyr222, Thr225, Val229, Ile268, Leu285, Met325, Leu327, and Pro347 of Dpb2, respectively. p59 and p261C are colored according to Fig. 1. Carbons of the modeled residues are colored purple. The residues are shown as sticks. The secondary structure elements are shown with 20% transparency. Blue dashed lines depict the closest distance between the residues. Proline and tryptophan rotamers, shown in A and B, respectively, correspond to minimal steric hindrance.

