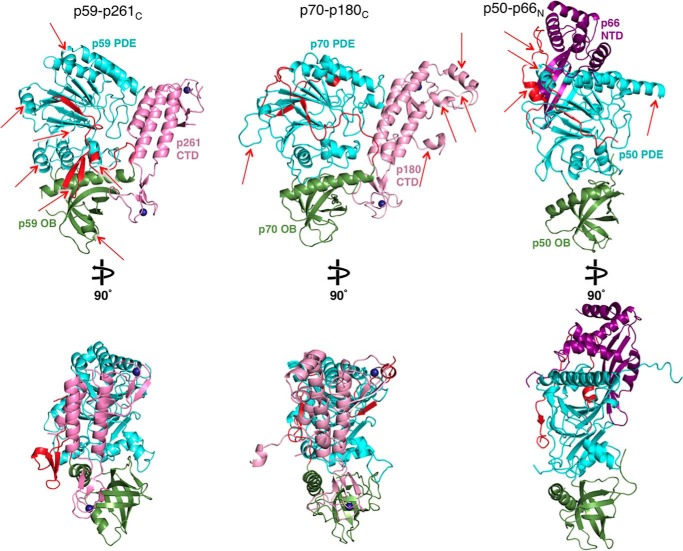
Figure 5.
Side-by-side comparison of the Polϵ p59–p261C, Polα p70–p180C, and Polδ/Polζ p50–p66N crystal structures. Red arrows indicate the structural elements contributing to significant differences between the three structures. The coloring of molecules is similar to Fig. 1, except the p66N domain of Polδ/Polζ C-subunit is colored purple. Two different orientations are shown for each molecule. The molecules are displayed using Protein Data Bank entries 5vbn, 5exr, and 3e0j.

