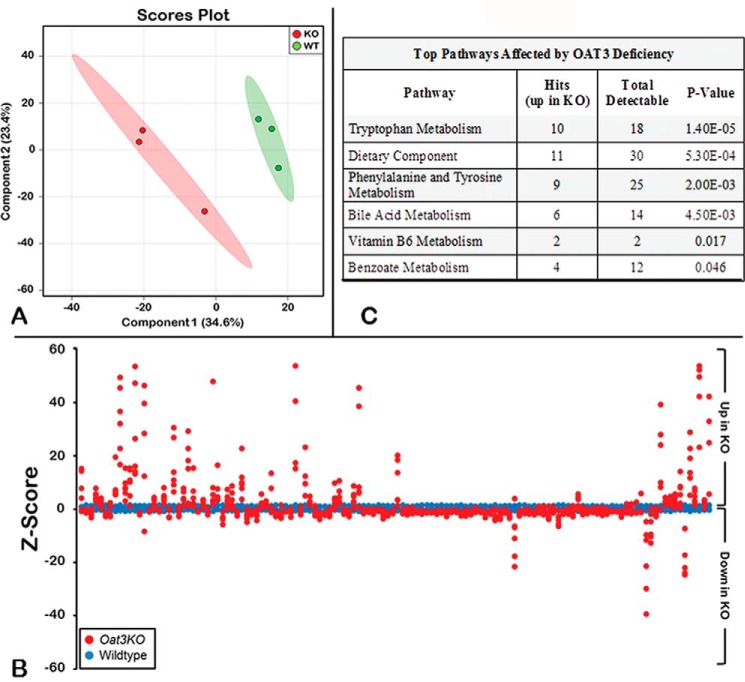
Figure 1.
Metabolomics profiling of serum distinguishes Oat3KOs from wild type. A, metabolomic profiling reveals separation between serum metabolites from Oat3KO (KO; red) and wild-type control mice (WT; green) by partial least squares discrimination analysis. B, Z-score plot of Oat3KOs metabolite intensities (red) against wild-type metabolites (blue). Each dot represents one metabolite observation for one sample, and positive changes in metabolite concentration (up in the plasma of the Oat3KO) are seen above the x axis, and negative changes in metabolite concentration (down in the plasma of the Oat3KO) are seen below the x axis. The distance from the x axis is the magnitude of the alteration in plasma concentration. As can be seen, although many metabolites show a decrease in their serum concentration in the Oat3KO, the metabolites displaying the largest changes in concentration are overwhelmingly those that accumulate in the plasma of the Oat3KO. C, table of pathway analysis of metabolites accumulating in the serum of the Oat3KO. The top pathways affected are shown and are ranked by p value (determined by hypergeometric test). Hits refer to the number of endogenous metabolites within each pathway that were found to significantly accumulate in the serum of the Oat3KO. Total detectable refers to the number of all metabolites in each pathway that are actually detectable on the metabolomics platform.

