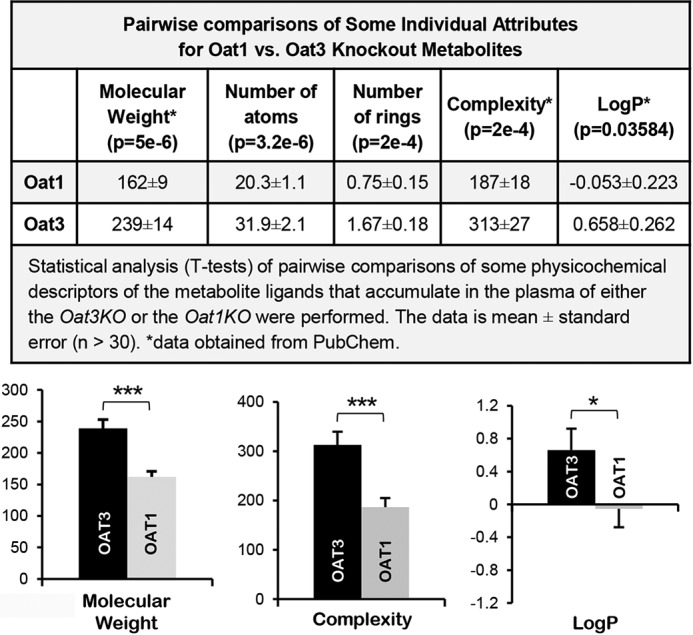
Figure 7.

Comparisons of physicochemical descriptors reveal significant differences between metabolites accumulating in the serum of the Oat3KO versus those accumulating in the Oat1KO. Top panel, table of pairwise comparisons of some physicochemical descriptors for endogenous metabolites with altered concentrations in Oat3KOs and Oat1KOs. Metabolites were compiled from either prior metabolomics analyses of the transporters (11, 12, 17, 20, 25, 83) or from this analysis of the Oat3KO. The p value for each comparison is indicated below the name of each attribute. The data for each attribute is the mean ± S.E. Bottom panel, a series of bar graphs for some of the attributes seen in the top panel to allow for visualization of the differences. The attributes compared in each graph are shown below the graph (black bar, OAT3; gray bar, OAT1; *, p ≤ 0.05; ***, p ≤ 0.001).
