
Table 3.
Examples from each OAT3 endogenous metabolite cluster with wet lab data showing interaction with OAT3
Exemplary chemical structures for metabolites in each group are shown (Column 2). Metabolites within each cluster for which in vitro data exist are shown in Column 3. If in vitro data do not currently exist for any of the metabolites within a cluster, then a structurally related molecule for which in vitro data exists for interaction with OAT3 is shown (Column 4, related metabolites with in vitro data).
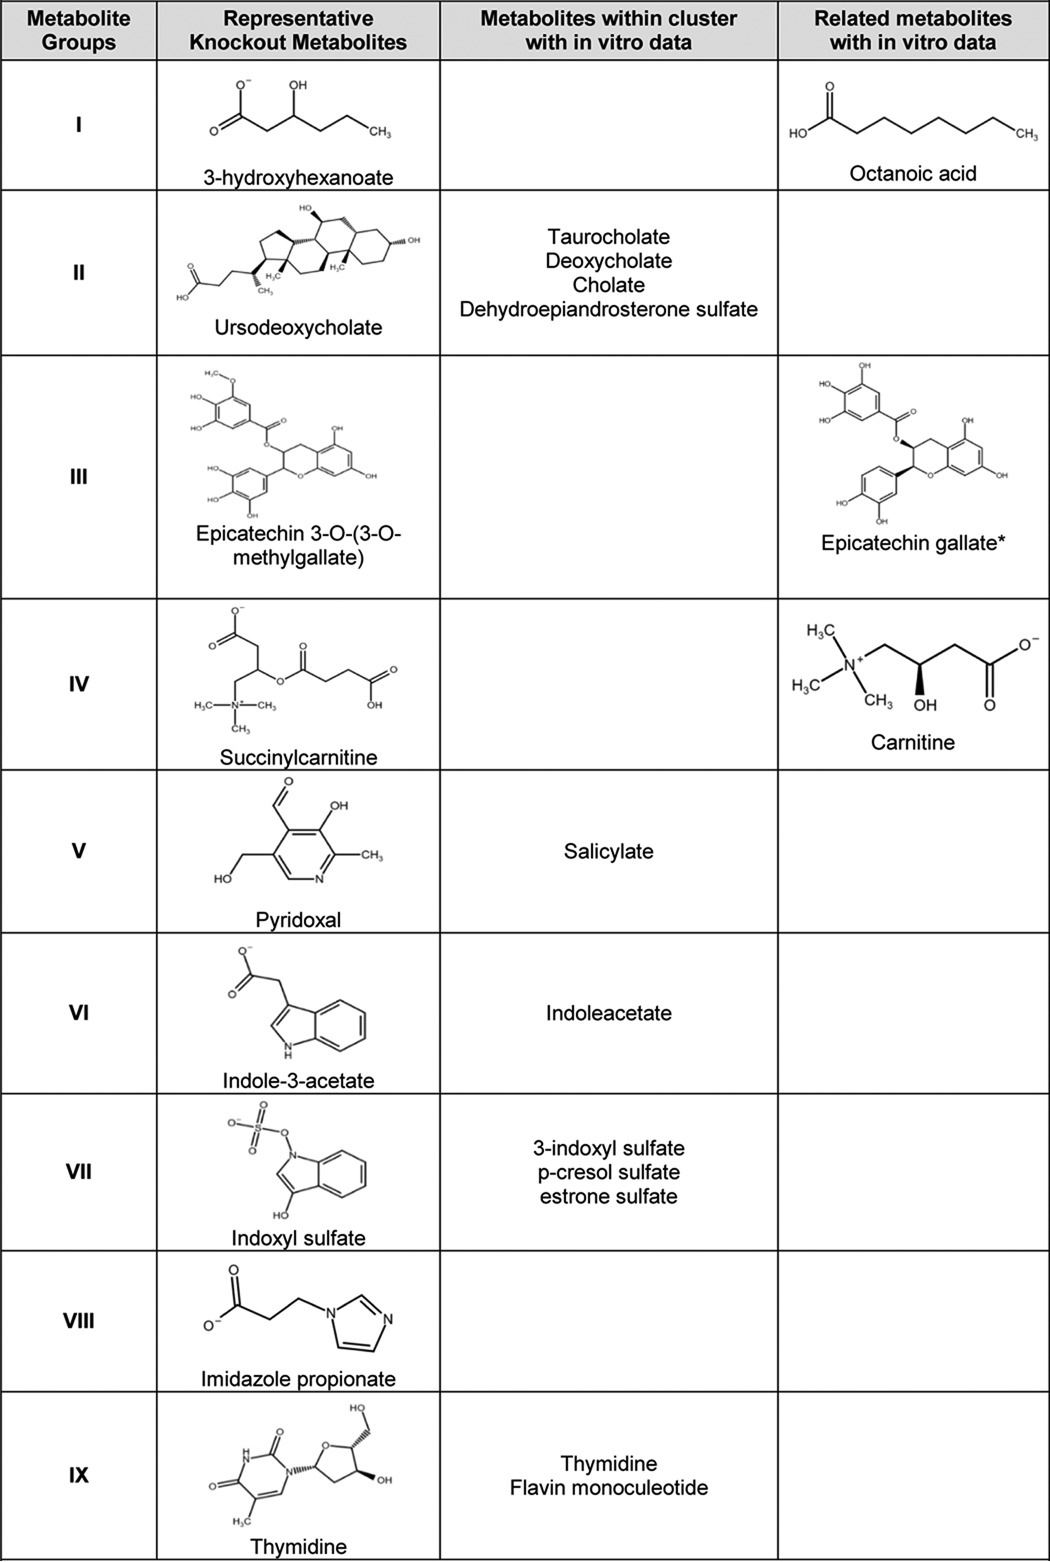
* Km, Ki, or IC50 data are not available, but it has been shown to inhibit Oat3-mediated transport activity.