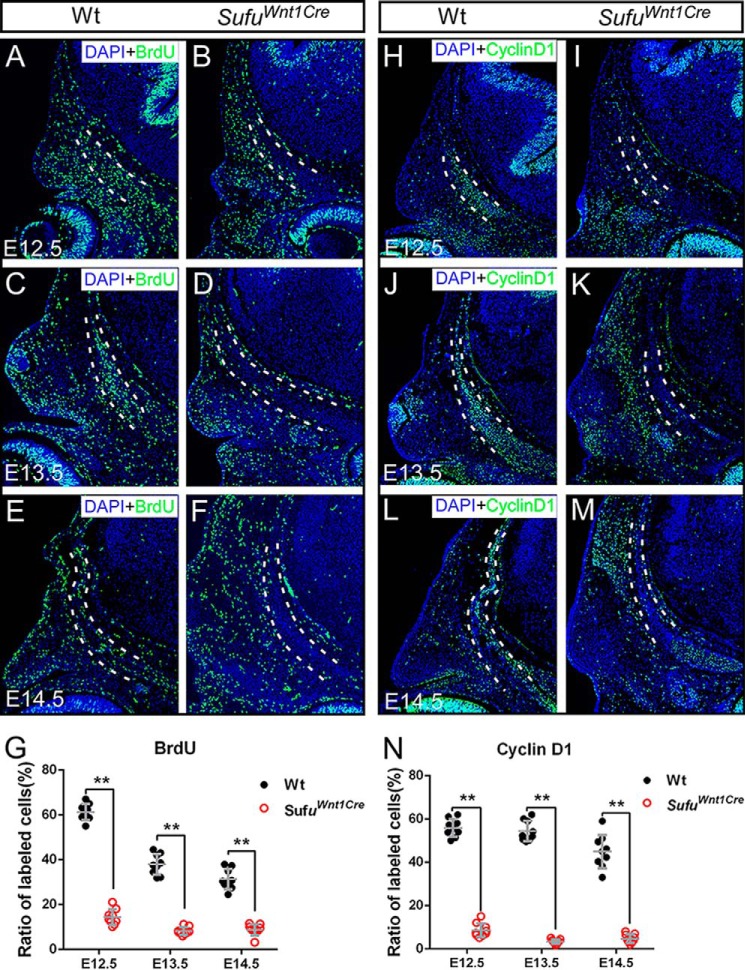
Figure 3.
Cell proliferation analysis of mesenchymal cells within the presumptive frontal primordium. A–G, BrdU labeling analysis showing the reduction of cell proliferation rate of mesenchymal cells within the presumptive frontal primordium in Sufufx/fx;Wnt1-Cre (SufuWnt1Cre) mutants compared with littermate control mice during E12.5–E14.5 (n = 3 animals, three serial sections for each). H–N, immunofluorescence staining using cyclin D1 antibody showing the reduction of cell proliferation within presumptive frontal primordium in Sufufx/fx;Wnt1-Cre (SufuWnt1Cre) mutants compared with littermate control mice (n = 3 animals, three serial sections for each). Dashed lines outline the presumptive frontal primordium. The cell proliferation rate was calculated with the number of BrdU or cyclin D1 marked cells divided by the DAPI-labeled cells within the presumptive frontal primordium. Statistical evaluation of the differential of cell proliferation rate between wild type and mutants was performed with Student's t test. Error bars, S.D. **, p < 0.01. Scale bars, 200 μm.

