Figure 2.
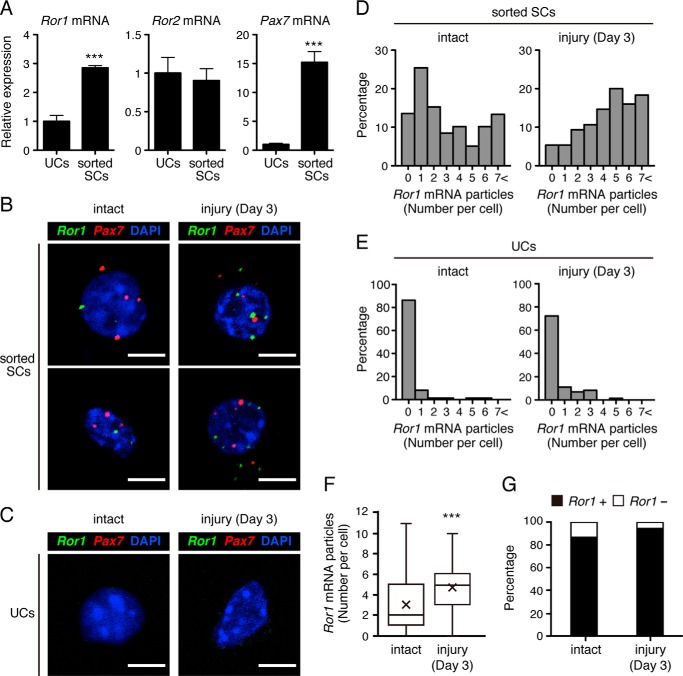
Expression of Ror1 is induced primarily in Pax7-positive SCs following skeletal muscle damage by CTX. A, sorted SCs and UCs were separated from the intact skeletal muscles by FACS. Expression levels of Ror1, Ror2, and Pax7 mRNAs in SCs and UCs were measured by qRT-PCR analysis. Relative expression values were determined by defining expression levels of the respective transcripts in UCs as 1. Data are expressed as mean ± S.D. (n = 3 animals). (***, p < 0.001, t test.) B, multicolor FISH analysis using probes for Ror1 mRNA (green) and Pax7 mRNA (red) in sorted SCs separated from the intact (left panels) or injured skeletal muscles (at day 3) (right panels). Scale bar, 5 μm. C, multicolor FISH analysis using probes for Ror1 mRNA (green) and Pax7 mRNA (red) in UCs separated from the intact (left) or injured skeletal muscles (at day 3) (right panel). Scale bar, 5 μm. D–F, quantification of the number of Ror1 mRNA particles per Pax7-positive cell in sorted SCs separated from the intact (D, left panels) or injured skeletal muscles at day 3 after treatment with CTX (D, right panels) or in UCs from the intact (E, left panels) or injured skeletal muscles at day 3 after treatment with CTX (E, right panels). Data of sorted SCs are presented as histograms in D and E and box-and-whisker plots with average values (×) in F (intact (day 0); n = 59, injury (day 3); n = 75). (***, p < 0.001, t test.) G, percentage of Ror1-positive or -negative cells in Pax7-positive cells separated from the intact or injured skeletal muscles (at day 3).

