Figure 8.
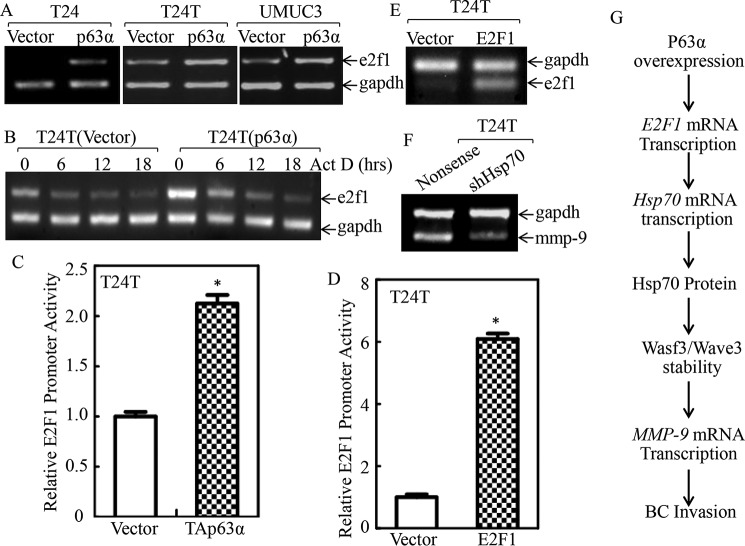
p63α promoted E2F1 transcription. A, the indicated stable transfectants were extracted with TRIzol reagent for total RNA isolation. e2f1 mRNA was determined with RT-PCR using the specific primers. GAPDH was used as an internal control. B, the T24T(Vector) and T24T(p63α) cells were treated with actinomycin D (Act D) for the indicated time points, then total RNA was isolated and subjected to RT-PCR for analysis of e2f1 mRNA degradation. GAPDH was used as a loading control. C and D, T24T(Vector) versus T24T(p63α) cells (C) and T24T(Vector) versus T24T(E2F1) cells (D) were transfected with an E2F1 promoter-driven luciferase reporter together with pRL-TK. The transfectants were seeded into 96-well plates to determine E2F1 promoter transcriptional activity. pRL-TK was used as an internal control to normalize the transfection efficiency. Each bar indicates the mean ± S.D. from three replicate assays. The asterisk indicates significant increases in E2F1 promoter-driven reporter activity in p63α-overexpressed cells (C) or in E2F1-overexpressed cells (D) in comparison with Vector transfectants (p < 0.05). E and F, T24T(Vector) and T24T(E2F1) cells (E) or T24T(Nonsense) and T24T(shHsp70) cells (F) were extracted for total RNA with TRIzol reagent. RT-PCR was used to determine endogenous e2f1 mRNA expression, whereas GAPDH was used as an internal control. G, illustration of proposed molecular mechanisms underlying overexpressed p63α promoting human BC invasion.

