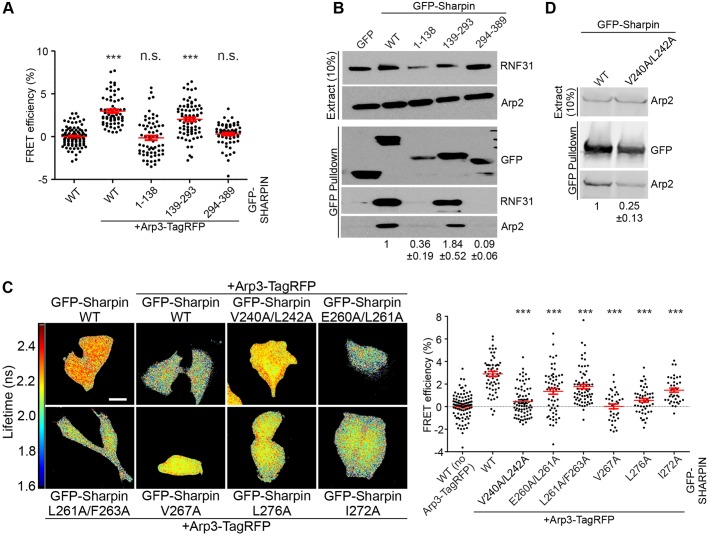
Fig. 3.
Mapping the Arp2/3 interaction site of Sharpin. (A) HeLa cells overexpressing the indicated proteins were subjected to FRET analysis by FLIM. The graph shows quantification of FRET efficiency (n=62–99 cells, from three experiments). (B) Pulldown experiments to determine the interaction between overexpressed GFP-Sharpin WT or its fragments and endogenous Arp2 from HEK-293 cells. Blotting for RNF31 confirmed the interaction of RNF31 with the Sharpin UBL domain. Numerical data are Arp2 levels in the pulldown, normalised to Arp2 levels in the extract and GFP levels in the pulldown (three experiments). (C) HeLa cells, overexpressing the indicated proteins were subjected to FRET analysis by FLIM. Fluorescence lifetimes, mapping spatial FRET in cells, are depicted using a pseudo-colour scale [red–yellow, normal lifetime; yellow–blue, FRET (reduced lifetime)]. Scale bar: 10 μm. The graph shows quantification of FRET efficiency (n=36–74 cells from three experiments; donor alone was set to 0 for each individual GFP–Sharpin construct). For statistical analyses, FRET efficiencies were compared to GFP–Sharpin WT. (D) Pulldown experiments to determine the interaction between overexpressed GFP–Sharpin WT and V240A/L242A and endogenous Arp2 from HEK-293 cells. Numerical data are Arp2 levels in the pulldown, normalised to Arp2 levels in the extract and GFP levels in the pulldown (three experiments). All numerical data are mean±s.e.m. ***P<0.001; n.s., not significant.

