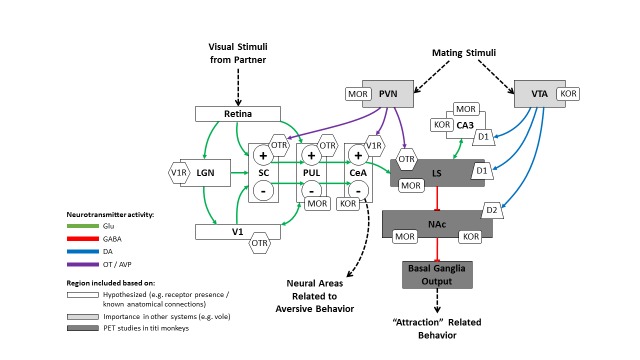
Figure 3.
Proposed model for the neurobiology of pair bond formation in male titi monkeys. Arrow heads indicate excitatory effects on the subsequent neural region while flat heads indicate inhibitory effects. Dashed lines represent either prior or later neural processing not detailed in the model. The + and – signs correspond to positively and negatively valenced neuronal populations respectively. Not all connections between areas are shown, in order to reduce the complexity of the figure. Region shading corresponds to the justification for inclusion in the model; white regions were hypothesized to be important for pair bond behavior based on a variety of factors (e.g. receptor presence, anatomical connections), light gray regions were included based on importance in other models (e.g. vole), and dark gray regions were included based on the results from PET studies we have previously conducted on titi monkeys. Abbreviations: CA3=hippocampus; CeA=central amygdala; LGN=lateral geniculate nucleus; LS=lateral septum; NAc=nucleus accumbens; PUL=pulvinar; PVN=paraventricular nucleus of the hypothalamus; SC=superior colliculus; VTA=ventral tegmental area; V1=primary visual cortex.

