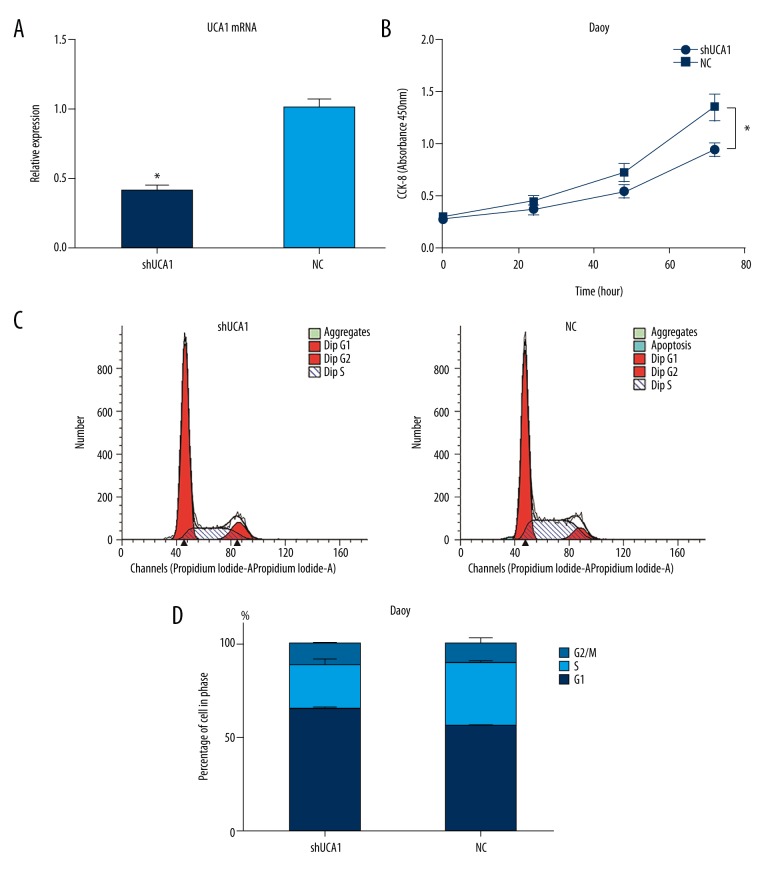
Figure 2.
Results of the CCK-8 assays and flow cytometry analyses performed following the knockdown of UCA1 in the Daoy cells (t-test). (A) Relative expression levels of UCA1 ±SD in the shUCA1 and NC groups as detected by RT-PCR (p<0.05). (B) OD450 values ±SD for the shUCA1 group were reduced by 30% compared to the NC group in the CCK-8 assays (p<0.05). (C) The distribution of cells among the phases of the cell cycle for the shUCA1 and NC groups as detected by flow cytometry. (D) The percentage of cells that were distributed among the three phases of the cell cycle ±SD in the shUCA1 and NC groups.

