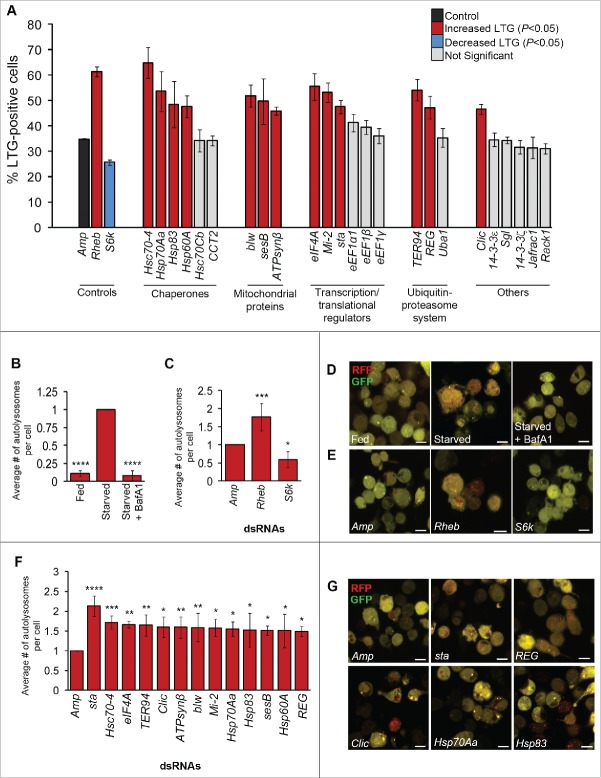
Figure 1.
Thirteen candidate Dcp-1 interactors modify LysoTracker® Green and autolysosomes in vitro (A) RNAi-treated l(2)mbn cells stained with LysoTracker® Green (LTG) and starved to measure autophagy-associated activity via flow cytometry. Error bars represent ± SEM(n = 3). Statistical significance was determined using one-way ANOVA with a Dunnet post-test. Knockdown of targets that significantly increased LTG levels are indicated in red (P < 0.05), and knockdown of targets that significantly decreased LTG levels are indicated in blue (P < 0.05). All samples were compared with the negative Amp control dsRNA (ampicillin resistance gene) that is shown in black. (B to G) Analysis of RFP-GFP-Atg8a puncta in RNAi-treated Drosophila S2 cells. At least 50 cells were counted per treatment (n = 3), and graphs represent the average number of autolysosomes per cell relative to the Amp control. Error bars represent the average ± SEM, and statistical significance was determined using one-way ANOVA with a Dunnet post-test. (B) Cells were subjected to nutrient rich or deprived conditions for 7 h in the presence or absence of 0.1 μM bafilomycin A1 (BafA1). ****P < 0.0001. (C) Cells were treated with Amp, Rheb, or S6k dsRNA and subjected to 7 h of starvation, *P < 0.05, ***P < 0.001. (D) Representative images of S2-RFP-GFP-Atg8a cells subjected to fed, starved, or starved + BafA1 conditions. (E) Representative images of S2-RFP-GFP-Atg8a cells treated with the indicated dsRNAs. (F) Cells were treated with the indicated dsRNAs and subjected to starvation conditions for 7 h. *P < 0.05, **P < 0.01, ***P < 0.001 ****P < 0.0001. (G) Representative images of S2-RFP-GFP-Atg8a cells treated with the indicated dsRNAs. Scale bars: 10 μm.

