Figure 4.
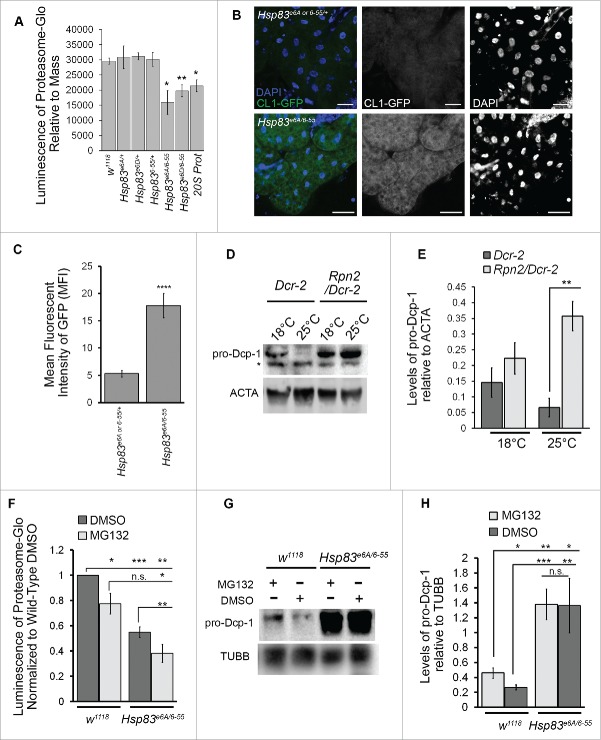
Loss of Hsp83 decreases proteasomal activity resulting in elevated Dcp-1 levels. (A) Proteasomal activity was measured in females from the indicated genotypes using luminescent output (RLU) produced from cleavage of proteasomal substrates (ProteasomeGlo kit) and made relative to mass. Error bars represent ± SEM and statistical significance was determined using one-way ANOVA with a Bonferroni post-test and compared with w1118, *P < 0.05, **P < 0.01. (n = 5) (B, C) UAS-CL1-GFP expressed in the larval fat body using the driver cg-GAL4 and visualized with nonadjusted GFP channel images taken in the same experiment with identical confocal microscope settings (n = 3). (B) Representatives images, scale bars: 50 μm and (C) quantification of fluorescence intensity using mean fluorescent intensity (MFI). Error bars represent ± SEM and statistical significance was determined using a 2-tailed Student t test, ****P < 0.0001. (D, E) Females with the maternal driver nosGAL4 were collected after 2 d of exposure to 18°C or 25°C with the genotypes +/UAspDcr-2; nosGAL4/+ (Dcr-2) and Rpn2-RNAI/UAspDcr-2;nosGAL4/+ (Rpn2/Dcr-2). (D) Representative western blot of pro-Dcp-1 and ACTA/actin levels in Dcr-2 and Rpn2/Dcr-2 pro-Dcp-1 = 35 kDa, ACTA/actin = 42 kDa, * represents a nonspecific band detected by the Dcp-1 antibody. (E) Quantification of pro-Dcp-1 levels was performed by densitometry and normalized to levels of ACTA/actin. The average relative levels of pro-Dcp-1 were determined with 8 females per lysate (n = 3). Error bars represent ± SEM and statistical significance was determined using a 2-way Student t test, **P < 0.01. (F) to H) Hsp83e6A/6–55 and w1118 flies were fed proteasomal inhibitor MG132 or the control DMSO for 4 d. (F) Proteasomal activity was measured and normalized to w1118 flies fed with DMSO (n = 3). Error bars represent ± SEM and statistical significance was determined using a Student t test, *P < 0.05, **P < 0.01, ***P < 0.001. (G) Representative image of a western blot probed for pro-Dcp-1(35 kDa) and TUBB/tubulin (55 kDa). (H) Quantification of pro-Dcp-1 levels was performed by densitometry and normalized to levels of TUBB/tubulin. The average relative levels of pro-Dcp-1 were determined with 8 females per lysate (n = 3). Error bars represent ± SEM and statistical significance was determined using a 2-way Student t test, *P < 0.05, **P < 0.01, ***P < 0.001.

