
Figure 1.
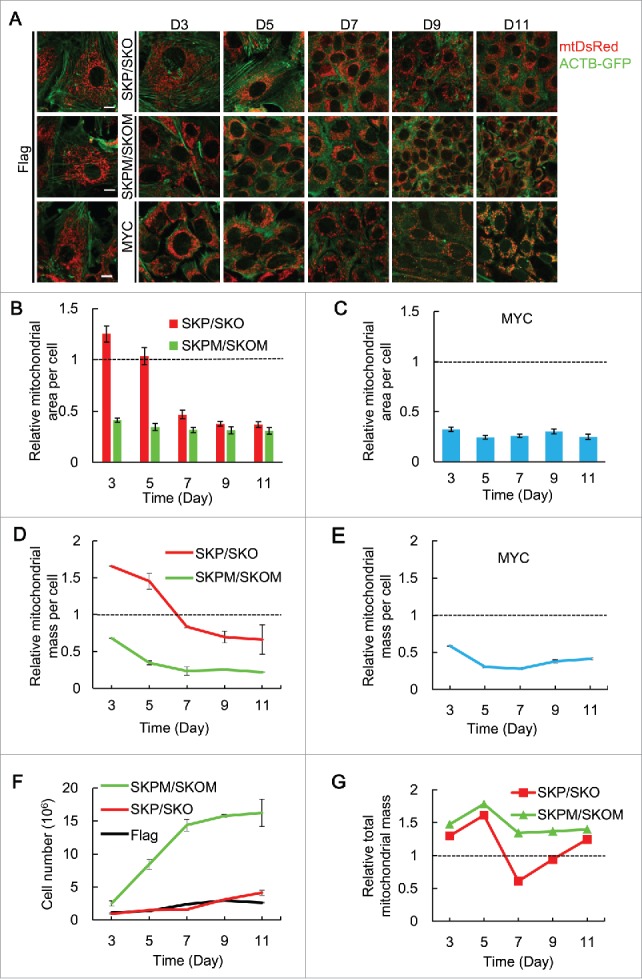
Mitochondrial mass decreases in MEFs undergoing reprogramming with SKP/SKO or SKPM/SKOM. (A) Indicative images for mitochondrial area in MEFs transduced with Flag, SKP/SKO, SKPM/SKOM or MYC for d 3, 5, 7, 9, 11 (for each group of images, mitochondria are shown in red, ACTB in green) Scale bars: 10 µm. (B) Quantification of relative mitochondrial area per cell transduced with SKP/SKO, SKPM/SKOM in (A). Mean average of 200 cells is shown ± 10. Error bars = s.e.m. (C) Quantification of relative mitochondrial area per cell transduced with single MYC in (A). Mean average of 200 cells is shown ± 10. Error bars = s.e.m. (D) Relative mitochondrial mass per cell transduced with SKP/SKO or SKPM/SKOM (n = 3). (E) Relative mitochondrial mass per cell transduced with MYC (n = 3). (F) Proliferation curves for cells transduced with Flag, SKP/SKO and SKPM/SKOM, respectively. (G) Total mitochondrial mass of cells transduced with SKP/SKO or SKPM/SKOM in a dish (calculated by mitochondrial mass/cell [Fig. 1D data] × cell number [Fig. 1F data]).