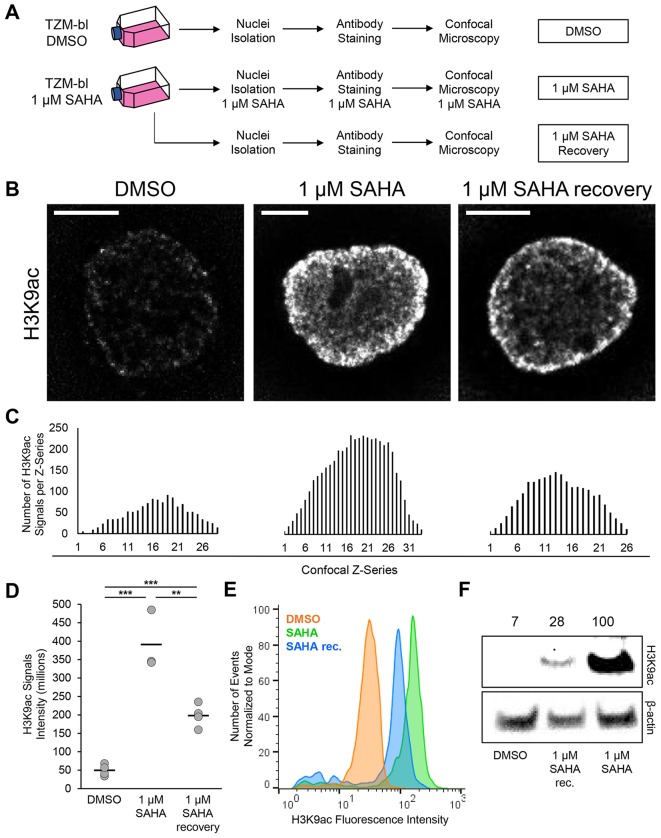
Fig. 2.
Examination of histone deacetylase inhibition in isolated nuclei. (A) Experimental workflow. TZM-bl cells were cultured for 48 h in medium containing 1 μM SAHA and processed for nuclei isolation, staining and microscopy (DMSO, untreated control). (B) Deconvolved confocal equatorial z-series of representative nuclei stained for acetylated H3 (H3K9ac). Scale bars: 5 μm. (C) Levels of H3K9ac signals in the confocal z-series for images shown in B. (D) Quantification of total H3K9ac signal fluorescence (DMSO, n=4; 1 μM SAHA, n=3; 1 μM SAHA recovery, n=4; bars indicate mean). (E) Quantification of H3K9ac fluorescence in isolated nuclei by flow cytometry. (F) Quantification of H3K9ac protein amount as determined by western blotting. **P≤0.01, ***P≤0.001 (Student's t-test, two-tailed, homoscedastic).

