Fig. 4.
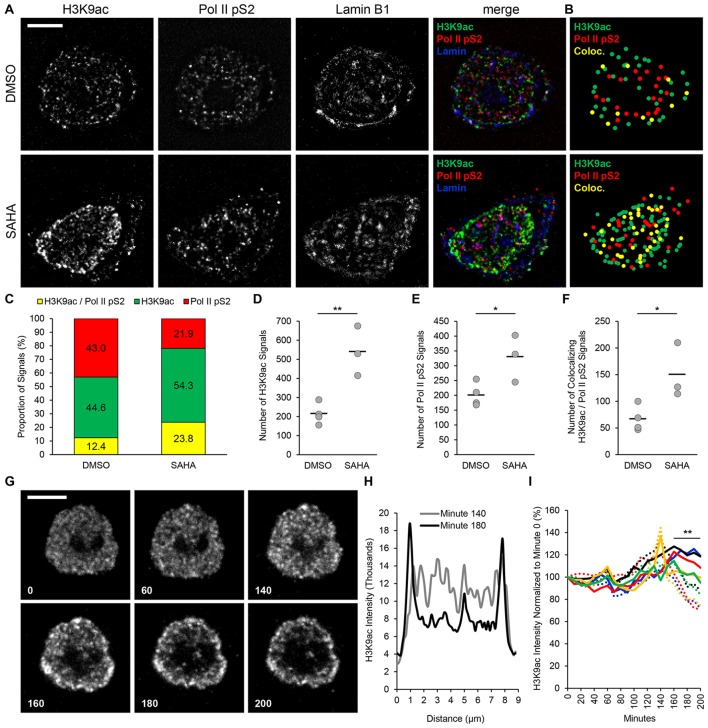
Visualization of chromatin reorganization in isolated nuclei. (A) Deconvolved images of nuclei isolated from TZM-bl cells treated with 1 μM SAHA and stained for acetylated H3 (H3K9ac, green), phosphorylated RNA polymerase II (Pol II pS2, red) and lamin B1 (blue). DMSO, untreated control. (B) Localization maps of images in A showing the position of H3K9ac (green dots), Pol II pS2 (red dots) and colocalizing H3K9ac and Pol II pS2 signals (yellow dots). (C) Quantification of H3K9ac and Pol II pS2 colocalization percentage for the nuclei shown in A. (D) Total number of H3K9ac and (E) Pol II pS2 and (F) colocalizing H3K9ac and Pol II pS2 signals detected in equatorial z-series (DMSO, n=4; SAHA, n=3; bars indicate mean). *P≤0.05, **P≤0.01 (Student's t-test, two-tailed, homoscedastic). (G) Time-lapse images of H3K9ac stain reorganization after 10 μM SAHA treatment; minutes are indicated at bottom left corner of each time point (images are not deconvolved). (H) Intensity profile of H3K9ac fluorescence detected along the diameter of the nucleus shown in G. (I) H3K9ac signal intensity measured in regions of interest at the periphery (solid lines) and center (dashed lines) of the H3K9ac stain; colors indicate five individual nuclei. Scale bars: 5 μm.

