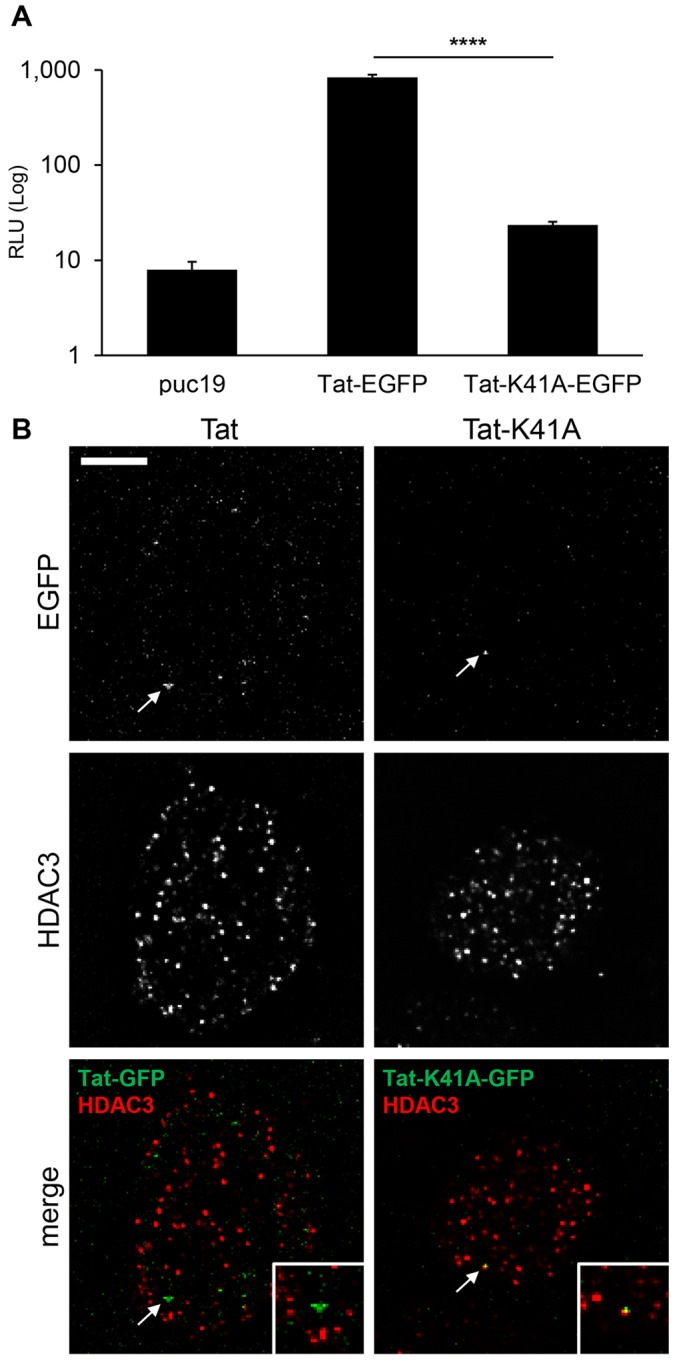
Fig. 6.

Localization of HIV-1 Tat and HDAC3 proteins in isolated nuclei. (A) Tat activity measured in a TZM-bl-based reporter assay by assessing the relative light units (RLU) produced. Results are mean±s.d. (n=3) ****P≤0.0001 (Student's t-test, two-tailed, homoscedastic). (B) Nuclei isolated from TZM-bl cells transfected with HIV-1 Tat–GFP or the mutant Tat-K41A–GFP were stained for HDAC3. Tat–GFP signals are indicated by white arrows; colocalizing Tat and HDAC3 are signals in yellow. Boxes in the merge panels magnify the areas indicated by the arrows. Deconvolved confocal equatorial z-series of representative nuclei are shown. Scale bar: 5 μm.
