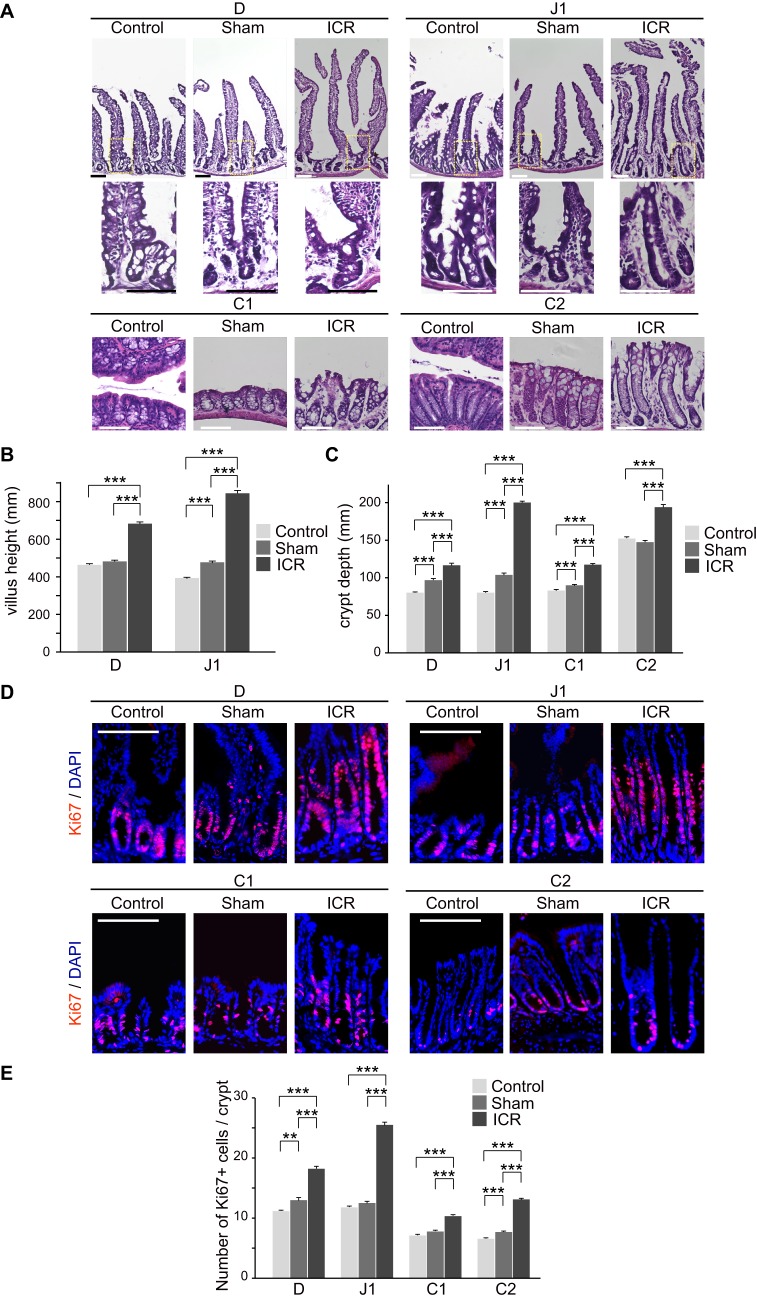
Fig. 3.
Histological alteration in remnant intestines in ICR mice on 14 POD. (A) Representative micrographs of four segments (D, J1, C1 and C2) in the remnant intestine in 75% ICR (ICR) mice and un-operated (Control) and sham operation mice (Sham). For small intestinal segments (D and J1), views of whole crypt-villus units (top) and magnified views of dotted boxes showing crypts (bottom) are presented. Representative images among those obtained from three mice are shown. Scale bar: 100 µm. (B,C) Measurement of villus height (B) and crypt depth (C) in ICR, sham operation and control mice. Twenty villi and crypts were analyzed per mouse and the data for 100 of those structures are presented (n=5). Data are expressed as the means±s.e.m. ***P<0.001 (Mann-Whitney U test). (D,E) Ki67+ cells in the remnant intestine in 75% ICR (ICR) mice and sham control mice (Sham). Representative immunofluorescent images among those obtained from 5 mice are shown in (D). Nuclei were stained with DAPI. Scale bars: 100 µm. (E) Quantification of Ki67+ cells per crypt (D) was performed by analyzing 20 crypts per mouse (n=5). Data are expressed as the means±s.e.m., **P<0.01, ***P<0.001 (Mann-Whitney U test).

