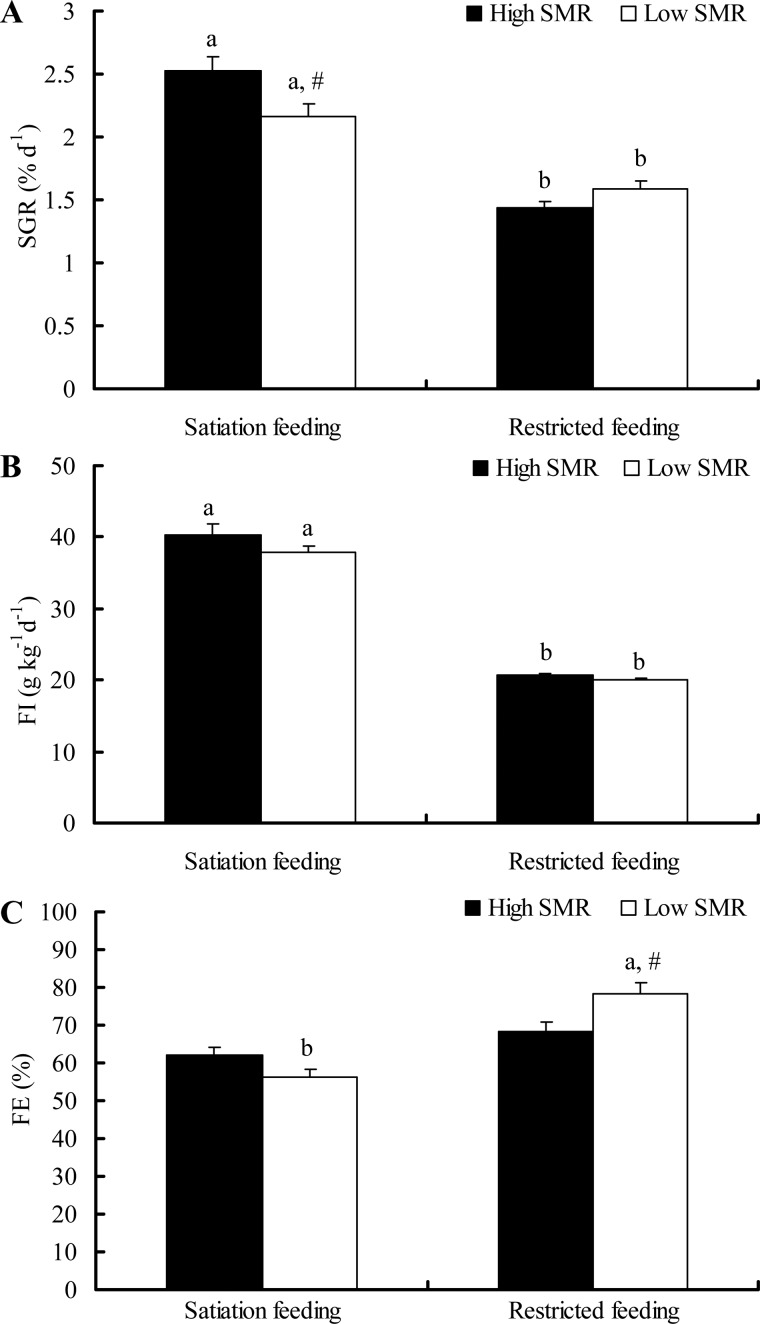
Fig. 1.
The SGR, FI and FE of individuals with two SMR phenotypes during feeding. The sample sizes were 19, 16, 20 and 16 for the high SMR satiation feeding group, low SMR satiation feeding group, high SMR restricted feeding group and low SMR restricted feeding group, respectively. Data are represented as the mean±s.e.m. Note that different common letters (A,B) within a given SMR phenotype are significant differences between two feeding treatments (P<0.05). The # symbol indicates a significant difference between high and low SMR phenotype under either satiation or restricted feeding conditions (P<0.05). The linear mixed models included SGR, FI and FE as the dependent variables, SMR and food treatment as explanatory variables followed by an independent-samples t-test.

