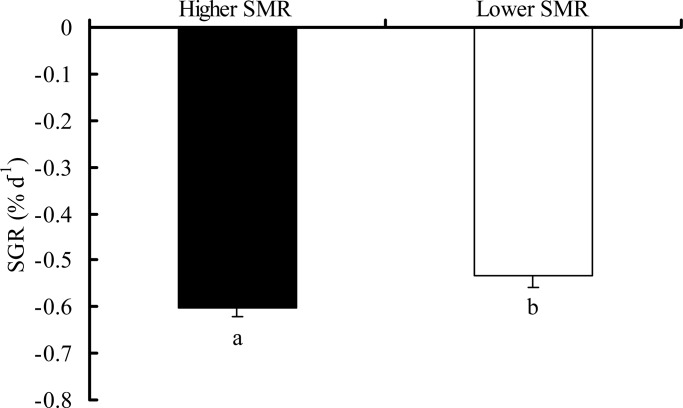
Fig. 3.
The decreased characteristics in body mass of the crucian carp with different SMR phenotypes during fasting. The high SMR group had a greater rate of mass loss during food deprivation as compared to the lower SMR group (two-tailed t-test, t=2.191, P=0.032). Data are represented as the mean±s.e.m. Different common letters indicate significant differences between two SMR phenotypes (P<0.05).

