Fig. 9.
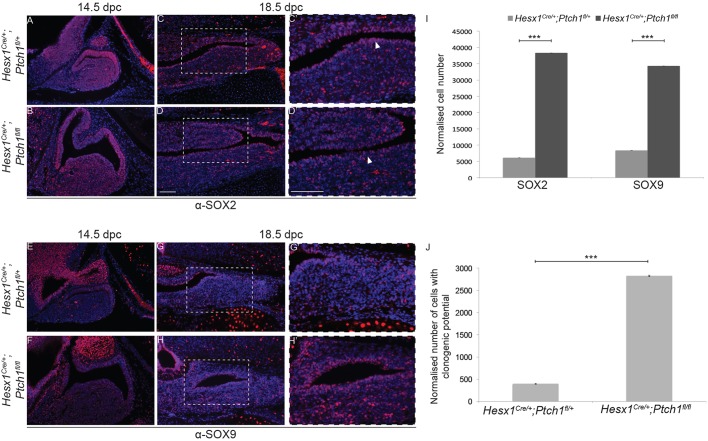
Increased numbers of SOX2+ and SOX9+ cells and enhanced clonogenic potential in Hesx1Cre/+;Ptch1fl/fl mutant pituitaries. Immunofluorescence for SOX2 and SOX9 on mid-sagittal (A,B,E,F) and frontal (C,D,G,H) sections of control and Hesx1Cre/+;Ptch1fl/fl mutant embryos at 14.5 and 18.5 dpc. (A-D) SOX2 expression is comparable between genotypes at 14.5 dpc, but is clearly expanded in the Hesx1Cre/+;Ptch1fl/fl pituitary relative to the control at 18.5 dpc. Note the thicker marginal zone in the mutant (arrowheads in C′ and D′). (C′,D′) Higher magnification of the boxed regions shown in C and D. (E-H) An expansion in SOX9 expression is observed in the mutant relative to the control pituitary at both 14.5 and 18.5 dpc. (G′,H′) Higher magnification of the boxed regions shown in G and H. (I) Quantitative analysis confirms the expansion of the SOX2+ and SOX9+ cell compartment at 18.5 dpc. (J) Quantification of the clonogenic potential of the pituitary in Hesx1Cre/+;Ptch1fl/fl mutants and control embryos at 18.5 dpc. A significant 3.4-fold increase is observed in the mutant pituitaries (n=6, ***P<0.01; data are mean±s.d., Student's t-test). Scale bars: 100 μm.

