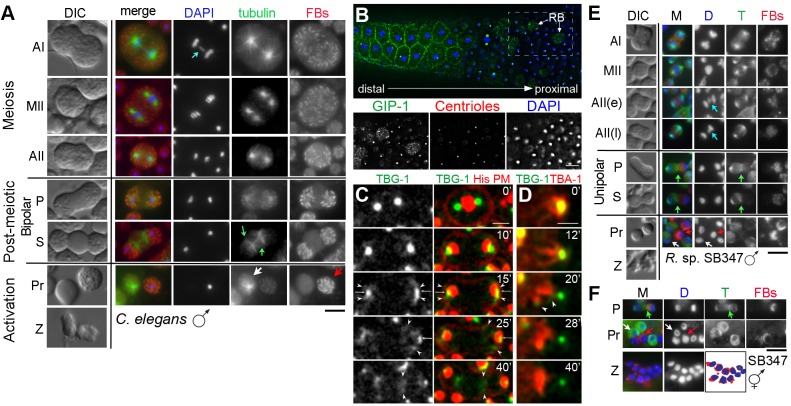
Fig. 2.
Microtubule dynamics and organelle partitioning during spermatogenesis in C. elegans and R. sp. SB347. (A-F) Live and/or fixed cells from C. elegans males (A-D), R. sp. SB347 males (E) and R. sp. hermaphrodites (F). (A,E,F) Fixed cells in which the DNA is labeled with DAPI (blue), the microtubules with anti-α-tubulin antibodies (green), and the fibrous bodies (FBs) with anti-MSP antibodies (red). Light blue arrows in DAPI columns show an unpaired X chromosome lagging during anaphase I in C. elegans male spermatocytes (A) and an unpaired X chromatid lagging during anaphase II in R. sp. SB347 male spermatocytes (E). Green arrows show new secondary microtubule foci (green). Left column in A and E shows same stage live cells imaged under DIC optics. (B) Fixed male gonad from C. elegans. DNA is labeled with DAPI (blue), endogenous GIP-1 with anti-GIP-1 antibodies (green), and centrioles with anti-IFA antibodies (red). Top image shows a developmental progression of spermatocytes in meiotic prophase on the left (distal) side and intermixed RBs (arrows) and sperm on the proximal side. Single-channel images of the boxed region are shown below. (C) Images of a live metaphase II spermatocyte transitioning to the separation phase showing the dynamics of γ-tubulin (GFP:TBG-1, green), chromosomes (histone:mCherry, red) and the cell membrane [mCherry:PH(PLC1δ1), red]. Small arrows indicate residual centrosomes. Arrowheads show non-centrosomal γ-tubulin. (D) Anaphase II to separation in a live spermatocyte expressing GFP:γ-tubulin (TBG-1, green) and mCherry:α-tubulin (TBA-1, red; time in minutes). Anaphase I (AI), metaphase II (MII), anaphase II (AII) post-meiotic partitioning (P) and separation (S) phases, the products (Pr) that include functional sperm (red arrows) and residual bodies (white arrows), and crawling spermatozoa (Z) are indicated. Scale bars: 5 µm.

