
Figure 2.
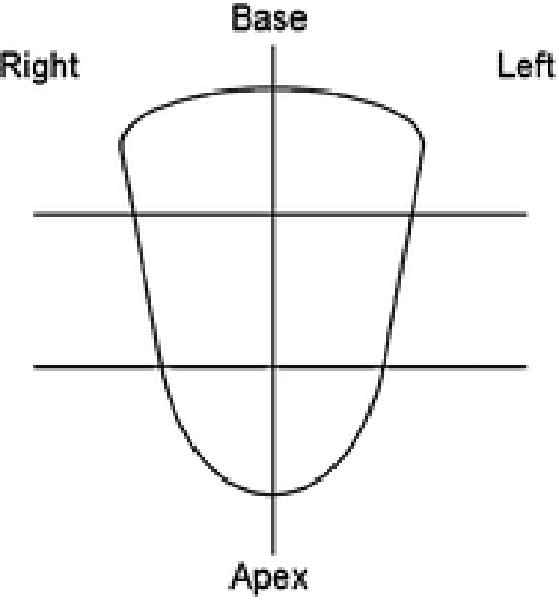
Schematic diagram of the six sectors used in the sector-based analysis for this study. Midline along with apical, mid, and base divisions were utilized to represent the prostate in six approximately equal sections.
Official websites use .gov
A
.gov website belongs to an official
government organization in the United States.
Secure .gov websites use HTTPS
A lock (
) or https:// means you've safely
connected to the .gov website. Share sensitive
information only on official, secure websites.
Schematic diagram of the six sectors used in the sector-based analysis for this study. Midline along with apical, mid, and base divisions were utilized to represent the prostate in six approximately equal sections.