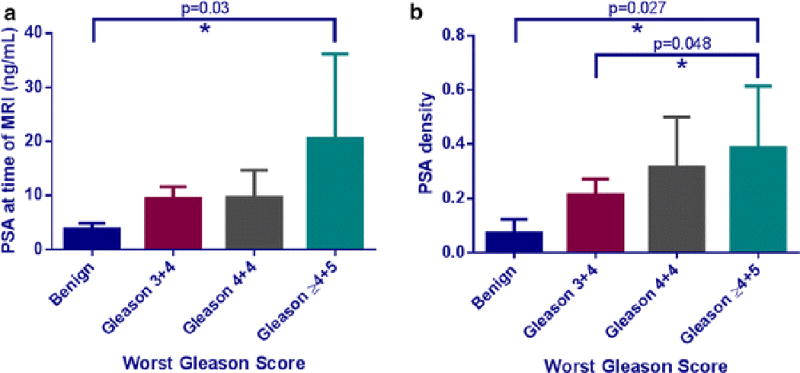
Figure 6.

(a) Mean serum PSA obtained at the time of MRI examination compared to the worst Gleason score obtained for each patient’s prostate cancer. The trend between PSA and Gleason was not significant, with p=0.13 on the Kruskal-Wallis test. The serum PSA values of benign and Gleason ≥ 4+5 disease were found to be significantly different with p=0.03 on the Dunn’s multiple comparison test. (b) Mean serum PSA density calculated at the time of MRI based on the planimetric MRI prostate volume compared to the worst Gleason score per patient. The trend between PSA density and Gleason score approached significance (p=0.055) on the Kruskal-Wallis test and there were statistically significant differences observed between PSA density in patients with benign disease compared to both the Gleason 4+4 and Gleason ≥ 4+5 categories, with p=0.048 and p=0.027 on the Dunn’s multiple comparison tests, respectively.
