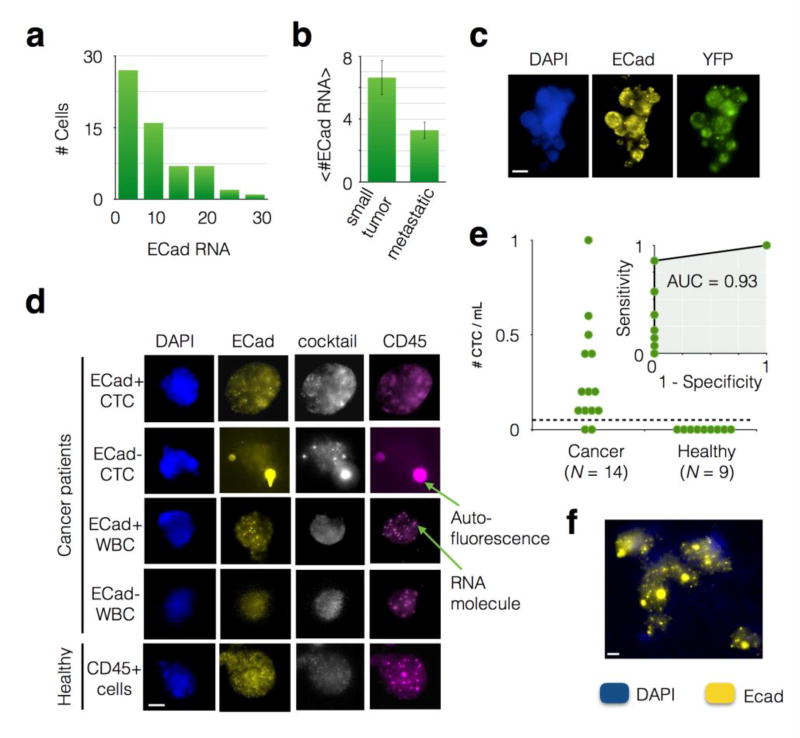
Figure 5. Application of CaTCh FISH Chip to murine and patient whole blood samples.
a. A histogram of the number of ECad RNA per CTC for blood taken from an individual KPCY mouse, showing the heterogeneity of ECad expression amongst CTCs. All cells in this histogram were cocktail+ (CK18, CK19, and Ctnnd1) and CD45-, identifying them as CTCs. b. The average number of ECad punctae per cell <#ECad RNA> for mice with small tumors versus mice with advanced lesions. A statistically significant difference P = 0.01 was found. Error bars represent standard error. c. An image of a circulating tumor cell cluster recovered from a KPCY mouse. Scale bar is 10 µm. d. Cells captured from advanced pancreatic cancer patients and healthy donors, including both ECad+ and ECad- CTCs and WBCs. e. The number of CTCs captured in patients with advanded pancreatic cancer versus those from healthy controls. The dashed line represents a threshold that can be defined to identify patients that have cancer. Inset: A Receiver Operator Characteristic (ROC) curve for the CatCH FISH, achieving an Area Under the Curve (AUC = 0.93). f. A CTC cluster recovered from a patient with pancreatic cancer. Scale bar is 4 µm.

