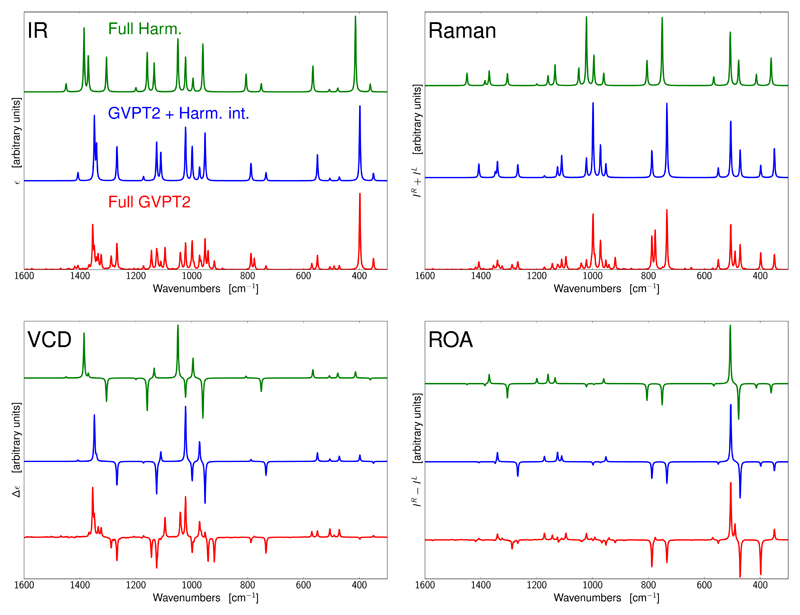
Figure 5.
Theoretical IR, VCD, Raman and ROA spectra of (R)-4-fluoro-2-azetidinone in the 300–1600 cm−1 range. Fully harmonic (harmonic energies and intensities) spectra (red, upper traces), spectra obtained by combining anharmonic wavenumbers with harmonic intensities (blue, middle traces) and fully anharmonic (anharmonic energies and intensities) spectra (green, lower traces). All computations have been performed at the B3LYP/SNSD level, and the computed lines have been convoluted by means of Lorentzian distribution functions with FWHM of 4 cm−1.

