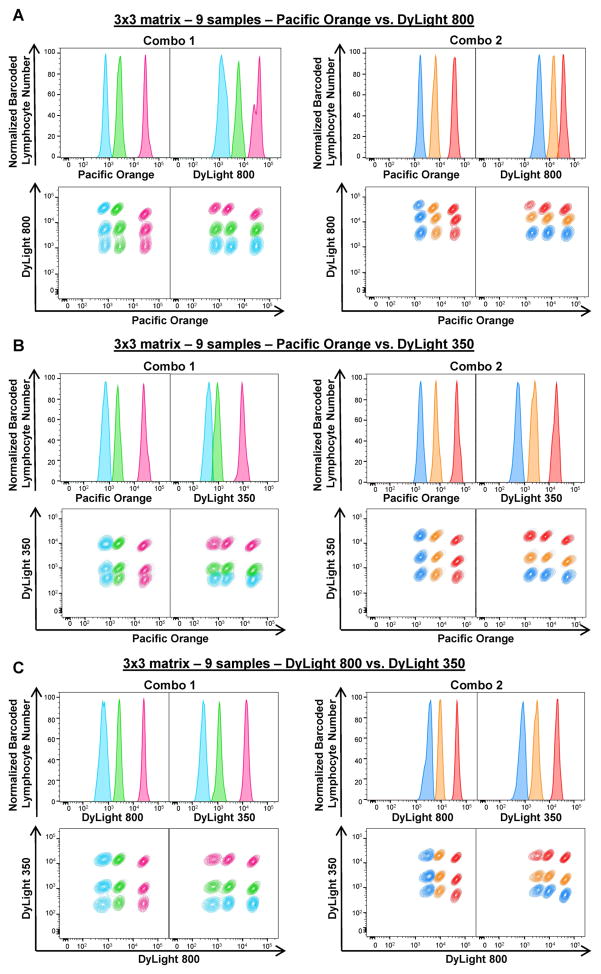
Figure 2. Two-dye barcoding combinations.
Two FCB dyes with different concentrations were combined as indicated and PBMCs were subjected to staining. To prepare a 3×3 matrix (9 samples), PBMCs (6–7.5×10⁵/30 μl/well) were stained with FCB dye combinations: Combo 1 (left panels) or Combo 2 (right panels) concentrations of Pacific Orange plus DyLight 800 (A), Pacific Orange plus DyLight 350 (B), or DyLight 800 and DyLight 350 (C). Single-parameter histograms (Normalized barcoded lymphocyte number vs Dye, top rows) and linear properties (Dye X vs Dye Y, bottom rows) were used to visualize barcoded lymphocyte populations for each matrix. Fluorescent peaks in the histograms and gated lymphocyte populations were displayed in the same colors of the corresponding dye concentration.

