
Figure 3.
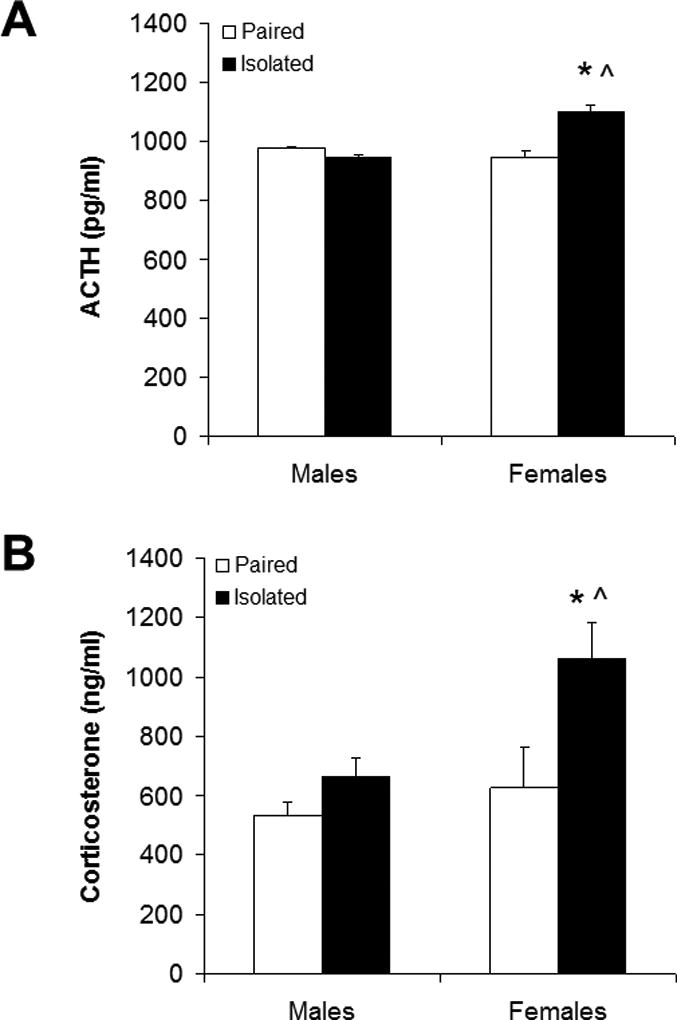
Plasma adrenocorticotropic hormone (ACTH; Panel A) and corticosterone concentrations (Panel B). Samples were collected following 10 days of chronic mild stress. Groups are isolated male (n=7), isolated female (n=7), paired male (n=6) and paired female prairie voles (n=6). Values are mean + standard error of the mean, SEM. *P < 0.05 vs. both paired groups; ^P < 0.05 vs. isolated male group (main effect of sex, housing, and housing by sex interaction, mixed-design ANOVA; t-tests with a Bonferroni correction).