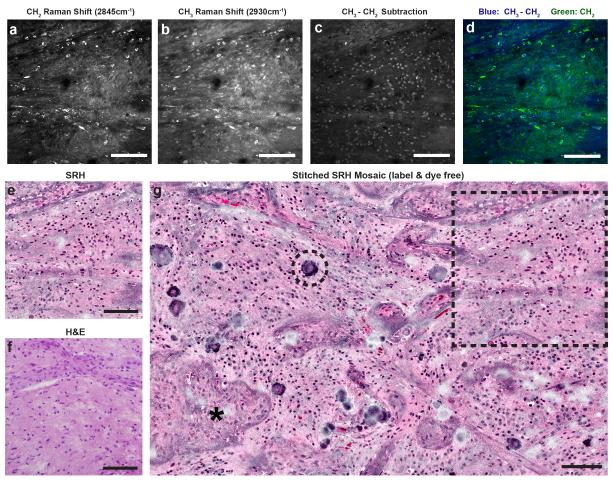
Fig. 2. Creating virtual H&E slides with the clinical SRS microscope.
(A) CH2 and (B) CH3 images are acquired and (C) subtracted. (D) The CH2 image is assigned to the green channel, and CH3-CH2 image is assigned to the blue channel to create a two-color blue-green image. Applying an H&E lookup table, SRH images (E) are comparable to a similar section of tumor (F) imaged after formalin-fixation, paraffin-embedding (FFPE), and H&E staining. (G) Mosaic tiled image of several SRH FOVs to create a mosaic of imaged tissue. Asterisk (*) indicates a focus of microvascular proliferation, dashed circle indicates calcification, and the dashed box demonstrates how the FOV in (E) fits into the larger mosaic. Scale bars = 100μm.

