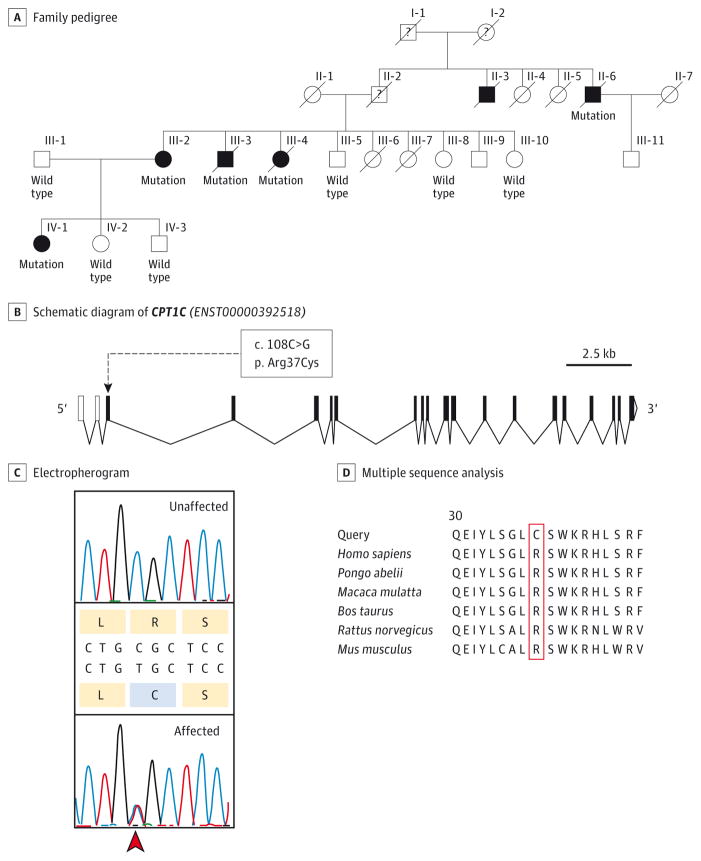
Figure 1. Pedigree and Sequence Analysis of CPT1C.
A, Pedigree of the family. White indicates unaffected individuals and black indicates affected individuals. Presence (mutation) or absence (wild type) of the mutation in CPT1C is indicated below each individual. B, Schematic diagram of CPT1C. Exons are represented as solid black boxes, noncoding exons are depicted as white boxes, and introns are depicted as bent connectors. The c.108C>G variant (p.Arg37Cys) is indicated. C, Electropherograms show the c.109C>T (p.Arg37Cys) variant (arrowhead) in CPT1C in an affected (heterozygote) and a nonaffected individual. D, Multiple sequence analysis of CPT1C in various species.

