Abstract
The aim of this study was to quantitatively characterize a micro focus x-ray tube that can operate in both continuous and pulsed emission modes. The micro focus x-ray source (Model L9181-06, Hamamatsu Photonics, Japan) has a varying focal spot size ranging from 16–50 μm as the source output power changes from 10–39 W. We measured the source output, beam quality, focal spot sizes, kV accuracy, spectra shapes and spatial resolution. Source output was measured using an ionization chamber for various tube voltages (kVs) with varying current (μA) and distances. The beam quality was measured in terms of half value layer (HVL), kV accuracy was measured with a non-invasive kV meter, and the spectra was measured using a compact integrated spectrometer system. The focal spot sizes were measured using a slit method with a CCD detector with a pixel pitch of 22 μm. The spatial resolution was quantitatively measured using the slit method with a CMOS flat panel detector with a 50 μm pixel pitch, and compared to the qualitative results obtained by imaging a contrast bar pattern. The focal spot sizes in the vertical direction were smaller than that of the horizontal direction, the impact of which was visible when comparing the spatial resolution values. Our analyses revealed that both emission modes yield comparable imaging performances in terms of beam quality, spectra shape and spatial resolution effects. There were no significantly large differences, thus providing the motivation for future studies to design and develop stable and robust cone beam imaging systems for various diagnostic applications.
Keywords: Pulsed beam emission, spatial resolution, beam quality, continuous beam
1. Introduction
Non-Destructive imaging (NDI) comprises a wide group of analytical techniques used in medical science and industry to evaluate the properties of an organ, tissue, material, component or system without causing damage [1–4]. Common NDI methods include micro computed tomography (micro-CT), digital radiography, optical imaging, penetrating liquids, vibration analyses, infrared thermography, acoustic emission analyses, and ultrasonic imaging, among others [4]. Modern x-ray based NDI systems are used in the preclinical and clinical environments for tumor detection and its monitoring, and investigation on the effectiveness of drugs in disease treatment [5–8]. One of the key component of modern x-ray NDI systems is the x-ray source that generates an x-ray beam for illuminating the sample for imaging purposes. Micro focus x-ray sources have been frequently used in the micro computed tomography (micro-CT) and specimen radiology for high resolution and high throughput imaging of small animals and specimens in the preclinical and clinical environments [9–15]. The small focal spot sizes of these sources allow to effectively utilize the magnification geometry which is not possible with the conventional sources due to the blurring associated with their large focal spot sizes. An emerging field that has become a hot research area in the past decade is the phase contrast imaging (PCI). One PCI method that works relatively well with polychromatic x-ray sources is the in-line or propagation-based imaging [16–18]. For exhibiting in-line PCI, the polychromatic x-ray wave illuminating the sample/tissue should be partially coherent which is characterized in terms of lateral coherence length given as L⊥ = λR/s [18–20], where λ is the wave length of the x-ray wave, R is the source-sample distance and s is the focal spot size of the source. Micro-focus x-ray tubes operated with sufficient source to object distances (SODs) can provide relatively large transverse coherent lengths and are frequently used for the implementation of in-line PCI [21–24]. One of the main reason that is limiting the wide use of micro focus x-ray sources in the patient imaging is the long exposure time associated with them to acquire a scan due to their limited output powers. Nevertheless, the technological developments have encouraged the design of new inline PCI set-ups which have permitted to extend the range of applications towards higher x-ray energies [25–27]. Numerous studies have implemented the in-line phase contrast tomosynthesis with micro-focus x-ray sources in preclinical studies with breast tissue samples, fish bone, mouse and rabbit lungs [28–30].
The micro focus x-ray sources used in the mentioned modalities operate in a continuous mode that emits x-rays constantly during its operation, and the x-ray detector records the spatially modulated wave emerging from an object/sample. Continuous emission sources utilize thermionic or field emission cathodes for the emission of electrons. Pulsed x-ray diagnostics and inspection are potentially capable of reducing the radiation dose considerably. Generating x-rays as a sequence of short flashes instead of continuous radiation is a distinguishing feature of the pulse x-ray source. Pulsed x-ray sources are commonly used in diagnostic imaging such as breast and lung screening. They provide the advantage of removing the shutter commonly utilized in breast tomosynthesis and cone beam breast CTs to block the x-rays during the source movement from one acquisition angle to the next, which avoids issues with image blur.
In this study, we aim to characterize a micro focus x-ray source that operates in both continuous and pulsed emission modes. For translating this hybrid micro focus x-ray source for advanced applications such as specimen radiography, tomosynthesis and cone beam breast CTs, it is vital to quantify its core performances in the projection imaging mode. This report is intended to provide a future baseline for the developers and scientists using hybrid x-ray sources for the development of efficient high resolution imaging modalities. To the best of our knowledge, this is the first detailed evaluation report of the continuous and pulsed emission modes of a hybrid micro focus x-ray source.
2. Hybrid Micro Focus X-ray Source
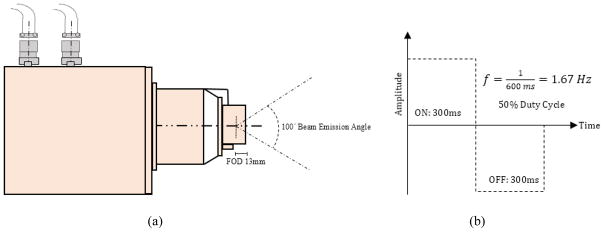
The micro focus x-ray source (Model L9181-06, Hamamatsu Photonics, Japan) is referred to as Hybrid due to the fact that it operates in both continuous beam and pulsed emission modes. The continuous emission mode operates with tube voltage and tube current ranging from 40–130 kV and 10–300 μA. The guaranteed x-ray tube voltage and current range in the pulsed emission mode is 80–130 kV and 50–300 μA. The target material (anode) of the source is tungsten (W) and the x-ray output window material is Beryllium (Be) with a thickness of 500 μm. The source has varying focal spot sizes ranging from 16–50 μm depending on its output power (W), which is the product of the source output voltage and current. The focal spot to output window distance (FOD) is 13 mm while the x-ray beam angle is approximately 100°, as shown in Fig. 1 (a). In the pulsed emission mode, the source self-emits the x-ray beam at a frequency of 1.67 Hz, which corresponds to a pulse duration of 600 msec. The 50% duty cycle of the pulse ensures on and off times of 300 msec as depicted in Fig. 1 (b). During the off time, the current (μA) drops to zero while the tube voltage (kV) remains at the preset value. During the on time, the current ramps up to the preset value allowing the x-ray emission to occur. The source can be synchronized to an external signal generator which allows to adjust the pulse width, duration and frequency in accordance to the 5V input square wave signal that the source would receive. The source has a full duplex serial interface communication method via RS-232 cable at 38400 bits per second data transfer speed. The physical dimensions (W×H×D) of the source are 167 mm×319 mm×172 mm, with a weight of approximately 10 kg.
Fig. 1.
(a) The schematics of the L9181-06 x-ray source (b) Self-running pulsed emission mode operating a frequency (f) of 1.67 Hz.
3. Characterization of the Source
After successfully installing the x-ray source on an optical rail, it is very important to characterize and monitor the source in both continuous and pulse emission modes on an ongoing basis to ensure reliable performance. Pulse emission mode was characterized with its self-running frequency (f) of 1.67 Hz with a pulse duration of 600 msec. This ongoing and periodic evaluation will help to detect changes that may result in a clinically significant degradation in the image quality or a significant increase in radiation exposure. This characterization will provide a baseline for future evaluations and comparisons. The source output, beam quality, focal spot measurements, kV accuracy, spectrum analyses and spatial resolution were measured in this study.
4. Continuous Emission Mode Results
4.1 Source Output
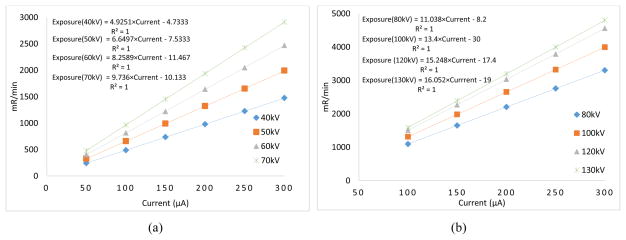
We utilized an air filled ionization chamber (Model 9095, Radcal Corporation, CA, USA) for the measurement of the source output for various tube voltage (kVp) values. The source output was measured with the ionization chamber placed at 100 cm away from the x-ray focal spot as per the guidelines of the American Association of Physicists in Medicine (AAPM) [31–33]. The current varied from 50–300 μA and the relationship between the current (μA) and exposure rate (mR/min) for various kV values are plotted in Fig. 2. The curves are fitted to the linear equation: y=mx+c. One can see that the exposure in the continuous emission mode linearly increases (R2=1) as the current increases.
Fig. 2.
Relationship between the exposure rate (mR/min) and current (μA) in the continuous emission mode for (a) 40–70 kVp (b) 80–130 kVp.
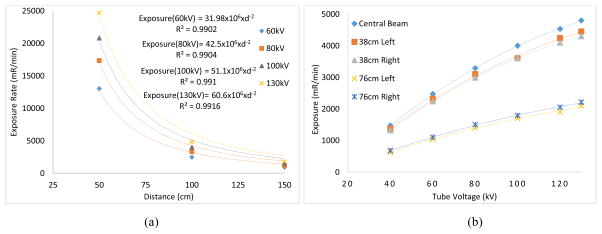
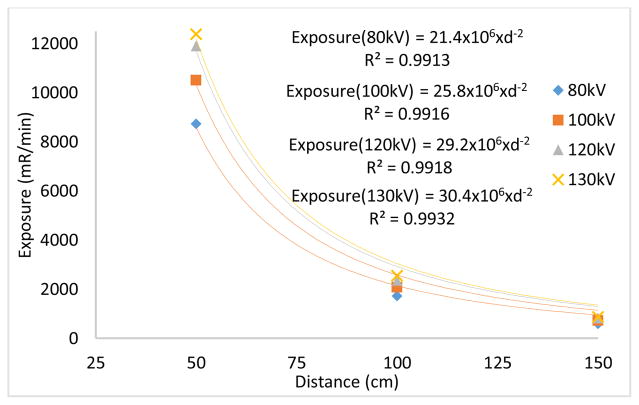
The source output measured in the beamline with an ionization chamber placed at source to image distances (SIDs) of 50 cm, 100 cm and 150 cm under various kVs. The exposure values were fitted to y = k.x−2, where y is the exposure rate, x is distance (cm) and k is a constant. From Fig. 3 (a), one can see that the output exposure values follow the inverse square law relationship with respect to the distance with high R2 values.
Fig. 3.
(a) Relationship between exposure rate and distance signifies the inverse square law relationship. (b) Exposure values measured at several lateral distances in an effort to investigate the coverage of field of view (FOV).
For an SID = 100 cm, lateral exposure values were measured in an effort to investigate the coverage of field of view (FOV). The ionization chamber was placed in two lateral distances, (a) 38 cm to left and right with respect to the central beam that corresponded to FOV of 76 cm (b) 76 cm to left and right that corresponded to FOV of 152 cm. From Fig. 3(b), one can see that lateral exposure values significantly drop as the ion chamber is laterally moved from 38 cm (FOV = 76cm) to 76 cm (FOV = 152 cm). It is due to the fact that the ion chamber placed laterally at 76 cm left or right is just outside the field of coverage which is defined by the source emission (cone) angle. For medical applications such as mammography and tomosynthesis, the FOV extends to the size of the detector which is usually about 30 cm in width. Therefore, necessary actions should be taken to narrow the FOV. X-ray collimators are routinely used for this very reason to make the size of FOV as to the desired medical application.
4.2 Beam Quality
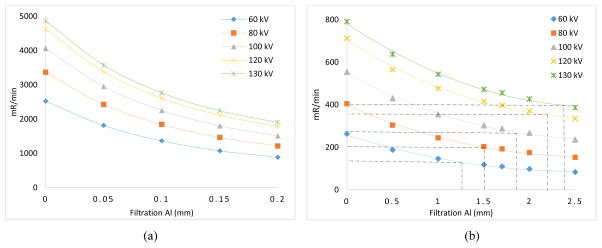
Beam quality was measured using the half value layer (HVL) with aluminum (Al) filters, according to the AAPM recommendations [31, 34]. During the measurements, it was observed that even with a small thickness of 0.05 mm Al, the x-ray beam intensity drops to 27–28 % as compared to the unfiltered beam. This clearly indicates that the unfiltered x-ray beam contains a large number of low energy photons, which do not contribute in the image formation. In fact, the majority will be absorbed by the tissue, resulting in an additional radiation dose. From the measured data, the (HVL) for different kVs are given in Table 1. As mentioned above, the unfiltered x-ray beam has a vast majority of low energy photons that are readily blocked by Al filters with small thicknesses, hence the HVL values for the kV values are small, as shown in Fig. 4 (a). With 1mm Al filtration at the exit window of the x-ray tube as an initial input, the x-ray beam is hardened. One can see from the tables these HVL values will help in imaging tissues at reduced radiation dose levels. One can directly estimate the HVL values directly from the given graphs. For example with 1 mm Al filter at the input end for 120 kV, the exposure rate is 712 mR/min with no added filtration. The exposure rate values decrease and becomes 356 mR/min at approximately 2.19 mm of added Al filtration.
Table 1.
Half value layer (HVL) in millimeters (mm) computed for different kVs with respect to different filtration at the input.
| kV | no filter | 1 mm Al filter | 1.5 mm Al filter | 2 mm Al filter |
|---|---|---|---|---|
| 60 | 0.1172 | 1.24 | 1.62 | 1.93 |
| 80 | 0.1212 | 1.50 | 2.0 | 2.41 |
| 100 | 0.1244 | 1.85 | 2.41 | 2.97 |
| 120 | 0.1296 | 2.19 | 2.92 | 3.6 |
| 130 | 0.1317 | 2.38 | 3.16 | 3.86 |
Fig. 4.
Half value layer (HVL) computed for several kVs with respect to (a) no filter at the input (b) 1mm Al filter at the input.
4.3 Focal Spot Size Measurements
The manufacturer’s specifications for the x-ray source indicate varying focal spot sizes according to the output power rating, and it is therefore important to measure the focal spot sizes for comparing it with the specified sizes. A slit camera (IIE GmbH, Aachen, Germany) was placed at SOD = 30.5 cm and SID = 183 cm, yielding a geometric magnification factor of M = 6. A CCD x-ray detector (Image Star 9000, Photonic Science, UK) with a pixel pitch of 21.7 μm was utilized to measure the focal spot sizes according to the technical procedure specified in the literature [35, 36]. The slit camera was carefully positioned so that it was either parallel (for measuring the width of the focal spot dimension) or perpendicular (for measuring the length of the focal spot dimension) to the anode–cathode direction. Multiple transverse profiles from the center section of the slit image were averaged, and the results were used for the determination of the full width at the half maximum (FWHM) of the focal spot images. The background signal was subtracted from each profile to ensure consistent results. Complete description of the method can be found in [36]. With the FWHM determined for each slit profile, the corresponding focal spot size was calculated as
| (1) |
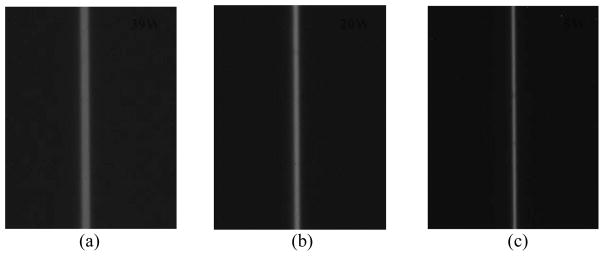
where FS represents focal spot size; M is the geometric magnification; and the factor 10 is the physical slit width in microns (μm). Fig. 6 shows the slit images (448×336) acquired under three output powers of 39W, 20W and 5W representing the horizontal dimension of the focal spot with respect to the anode-cathode direction. From these images, one can visually see that (a) the slit has good alignment to ensure a more accurate representation of an across-slit digital profile, (b) the width of the slit increases with the operating power of the x-ray tube. Thus the width of the slit is largest for 39W and smallest for 5W.
Fig. 6.
Slit camera images acquired using a CCD detector: (a) 39 W (130 kV, 300μA), (b) 20 W (100 kV, 200μA), (c) 5 W (100 kV, 50μA)
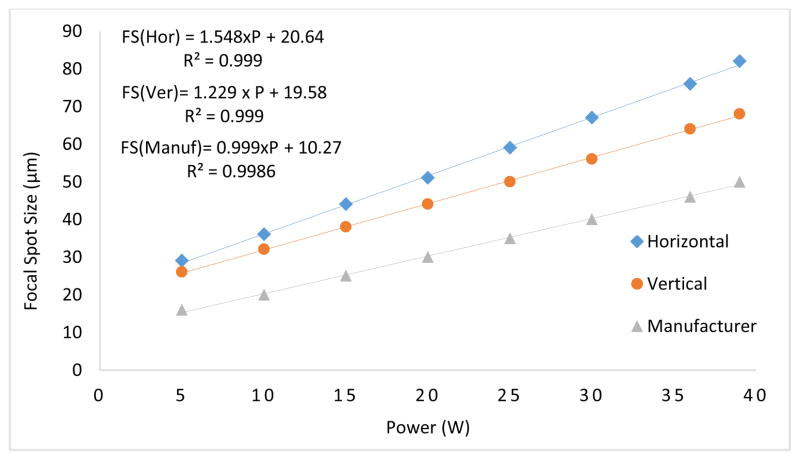
The focal spot sizes were measured in the two dimensions and plotted against the output power (W) and were compared to the manufacturer-provided specifications in Fig. 7. The focal spot sizes were linearly fitted with respect to the input tube power (W). One can see that there is a strong linear relationship (R2>0.99) between the two axes. As compared to a small focal spot, a large focal spot produces a greater blur in the output images of the system, which results in a wider FWHM. For example, the 39 W horizontal slit image produces a FWHM value of 470 μm (21.7 μm × 21 pixel) as compared to a FWHM value of 315 μm (21.7 μm × 14 pixel) produced by the 20 W image. In addition, the focal spot sizes in the vertical direction are smaller than that of the horizontal direction.
Fig. 7.
Focal spot sizes in the two planes plotted against the output power (W) are compared to the manufacturer data.
4.4 kV Accuracy
Accuracy of the kilo voltage was evaluated with a noninvasive kV meter (Radcal Corporation, CA, USA). As shown in Table 2, the output voltage was within ±1V for input voltages between 40 and 80kV, while the output voltage was within ±3V for 90–130kV.
Table 2.
The measured output voltages (kV) of the x-ray tube for three varying current values.
| Input kV | Output kV (300μA) |
|---|---|
| 40 | 39.4 |
| 50 | 49.7 |
| 60 | 59.5 |
| 70 | 70.5 |
| 80 | 80.7 |
| 90 | 92.6 |
| 100 | 102.7 |
| 110 | 112.7 |
| 120 | 122.5 |
| 130 | 132.7 |
4.5 Spectra Measurements
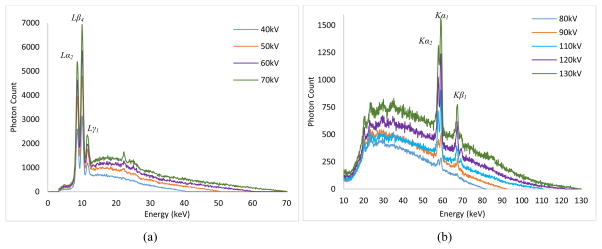
The quality of the x-ray beam is affected predominantly by kilo-voltage peak (kVp) selection, thus it is very important to know the waveform of the x-ray beams at different energies and at different filtration levels. For the determination of the waveform, we used a compact integrated spectrometer system (X-123CdTe, Amptek Inc., Bedford, USA) which includes a cadmium telluride (CdTe) x-ray detector, a preamplifier, a digital pulse processor and a multichannel analyzer (MCA). For the 40–70 kV waveforms, we did not employ any external filtration. However, for the waveforms between 80–130 kV, we employed a 2.5 mm thick aluminum (Al) filter to remove the low energy photons and allow viewing the K edges of the target material (tungsten) prominently. The input rates for the acquired spectrum measurements were below 2500 counts/sec. The spectrum measurements in the continuous emission of the x-ray source are given in Fig. 8. One can see the L series peaks of the tungsten (W) material for 40–70kV, while the K series peaks can be seen for the 80–130kV range.
Fig. 8.
Output spectrum measurements for the tube in continuous emission mode for (a) 40–70 kV (b) 80–130kV.
4.6 Spatial Resolution
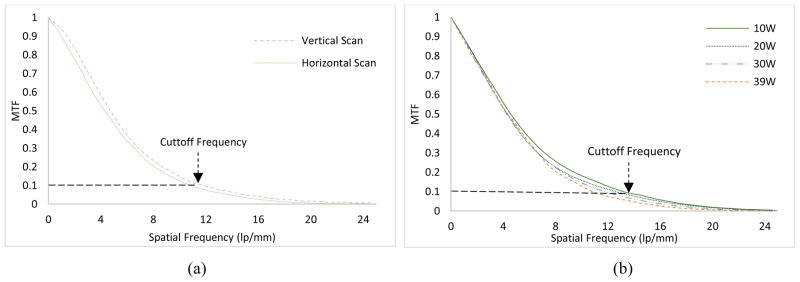
It is expected that the focal spot size variation with respect to output power (W) will have an impact on the spatial resolution. The same slit camera was employed for the measurement of modulation transfer function (MTF) from an oversampled line spread function (LSF) [37,38]. The slit camera was slightly tilted (2°~ 4°) and placed at a SOD of 68 cm. A CMOS flat panel detector (Hamamatsu, C7942SK-25) with a pixel pitch of 50μm was used to image the slit. The SID was 170 cm, resulting in a magnification (M) factor of 2.5. Fig. 9(a) represents the MTF curves in the two scanning directions for a 30 W output power. As compared to the horizontal scan, the vertical scan produces higher MTF values. The cutoff frequencies (10% MTF) are 11.75 lp/mm and 10.93 lp/mm in the two scanning directions. Similar observations can be found in previous studies [37, 39]. The remaining assessment of the spatial resolution was performed in the vertical direction. The MTF curves for four different output powers in the continuous emission mode are given in Fig. 9(b). As expected, the focal spot size variation with respect to output power (W) has a direct impact on the spatial resolution. The slit images were all acquired at 100 kV except for 39 W, where 130 kV was used. The cutoff frequencies (10% MTF) for 10W, 20W, 30W and 39W correspond to 13.4 lp/mm, 12.61 lp/mm, 11.75 lp/mm and 11 lp/mm, respectively.
Fig. 9.
(a) MTF curves in the two scanning directions for 30W output power (W) (b) MTF curves for different output powers of the source ranging from 10–39W
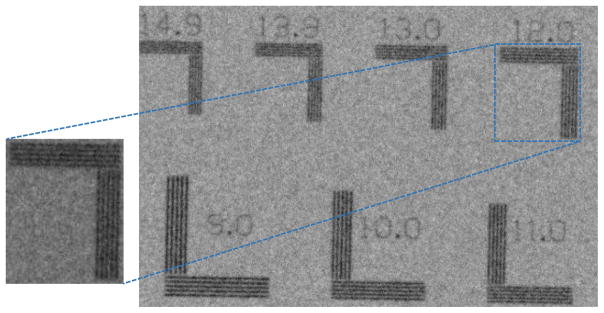
For the qualitative assessment of the spatial resolution, an ultra-high contrast resolution bar chip phantom (016B, CIRS, Virginia, USA) was utilized. The phantom has a 17.5 μm thick gold-nickel (Au-Ni) alloy bar pattern with 18 segments ranging from 5–28 lp/mm. At 10W, the 13 lp/mm bar lines are differentiated from each other, while the 11 lp/mm bar lines are differentiated at 39 W, as shown in Fig. 10.
Fig. 10.
The bar chip phantom images represents the qualitative assessment of the spatial resolution in (a) 10W, 100kV, 100μA (b) 39W, 130kV, 300μA.
5. Pulsed Emission Mode Results
5.1 Source Output
The source output measured for the guaranteed voltage range (80–130 kV) in the beamline at several distances was measured and the relationship between the exposure rate (mR/min) and distance (R) is plotted in Fig. 11. One can see that the pulse output is about half that of the continuous beam output, due to the fact that the pulse beam operates with a 50% duty cycle. This means that for a one minute exposure, the on and off times are 30 seconds each for the pulse beam, as compared to a full one minute on time for the continuous beam. For example, at 100 cm for 100 kV, the source output in pulse and continuous emission mode is 2.07 R/min and 4 R/min.
Fig. 11.
Exposure output (mR/min) plotted against distance (R) shows the inverse square law relationship.
5.2 Beam Quality
Table 3 provides the recorded exposure rates using various thicknesses of Al under the guaranteed kVs in the pulsed mode. Again, it is clear that with a small thickness of 0.05 mm Al, the x-ray beam intensity drops to 30–31 %. This clearly demonstrates that the unfiltered x-ray beam contains a large number of low energy photons in the pulsed mode emission, which do not contribute to the image formation and instead result in an additional radiation dose absorbed by the tissue.
Table 3.
Exposure rate readings with several thicknesses (0 to 1.5 mm) of Aluminum filters under different kVs.
| Condition | No Filter | 0.05 mm | 0.1 mm | 0.2 mm | 1 mm | 1.5 mm | 2 mm |
|---|---|---|---|---|---|---|---|
| 80kV, 300μA | 1.72 R/min | 1.19 R/min | 913 mR/min | 593 mR/min | 200 mR/min | 150 mR/min | 118 mR/min |
| 100kV, 300μA | 2.07 R/min | 1.43 R/min | 1.11 R/min | 740 mR/min | 276 mR/min | 213 mR/min | 172 mR/min |
| 120kV, 300μA | 2.35 R/min | 1.65 R/min | 1.28 R/min | 870 mR/min | 352 mR/min | 281 mR/min | 232 mR/min |
| 130kV, 300μA | 2.54 R/min | 1.76 R/min | 1.34 R/min | 924 mR/min | 390 mR/min | 316 mR/min | 262 mR/min |
The half value layer (HVL) values for 80–130 kV are given in Table 4. As with the unfiltered x-ray beam in continuous emission mode, the vast majority of low energy photons that are readily blocked by Al filters with very small thicknesses result in small HVL values. With 1mm Al input filtration at the exit window of the x-ray tube, the x-ray beam becomes harder and one can see from the table that these HVL values will help in imaging tissues at reduced radiation dose levels. HVL values in both emission modes are similar to each other. For example, with 1.5 mm Al at the output window of the source at 100 kV, the resultant HVL values are 2.34 mm and 2.4 mm of Al in both pulse and continuous emission modes, respectively.
Table 4.
Half value layer (HVL) computed for different kVs with respect to different input filtration.
| kV | HVL, no filter | HVL, 1 mm Al filter | HVL, 1.5 mm Al filter |
|---|---|---|---|
| 80 | 0.1139 | 1.45 | 1.95 |
| 100 | 0.1172 | 1.85 | 2.34 |
| 120 | 0.1194 | 2.19 | 2.81 |
| 130 | 0.1206 | 2.38 | 3.0 |
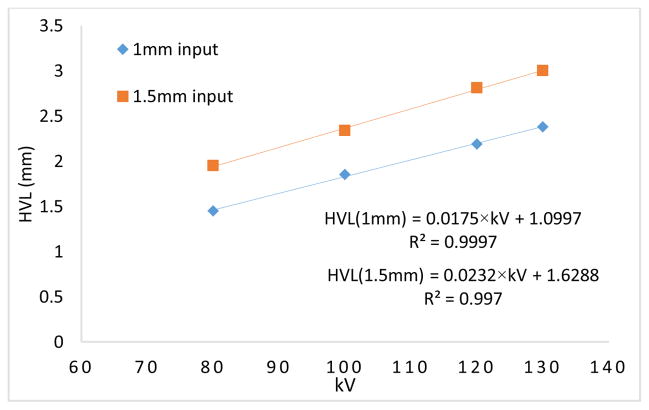
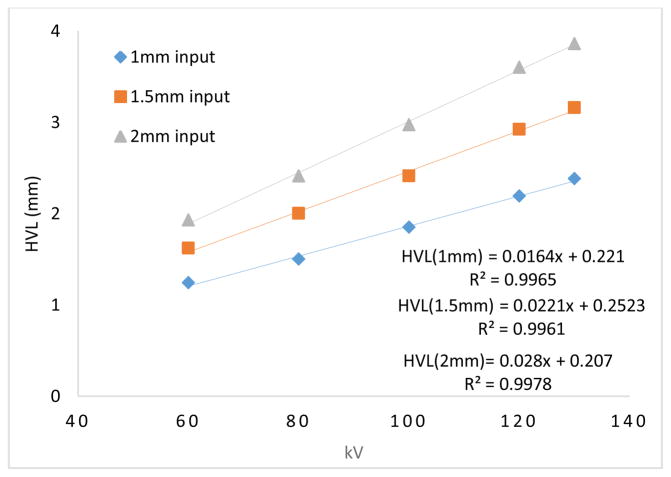
The HVL and kV values are linearly related for any fixed filter thickness at the output window of the x-ray tube as shown in Fig. 12. For example, with a 1.5 mm Al filter, the HVL increases from 1.95 to 3 mm as the tube voltage increases from 80 kV to 130 kV.
Fig. 12.
Half value layer (HVL) and tube potential (kV) relationship plotted for 1 mm and 1.5 mm Al filters at the tube output window.
5.3 Spectra Measurements
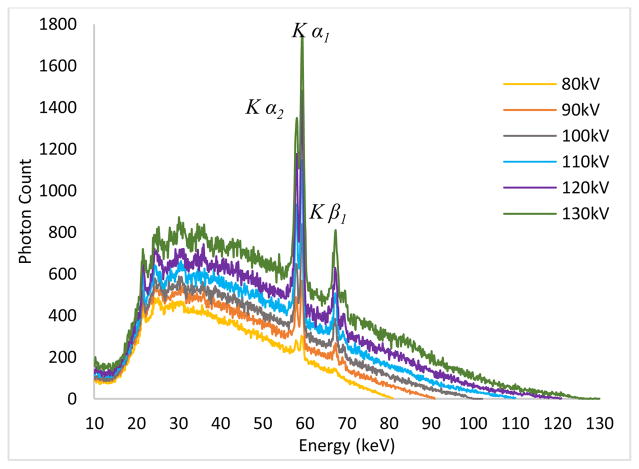
The kV waveforms in the pulsed emission mode of the x-ray source are given in Fig. 13. Similarly to the continuous emission mode, a 2.5 mm thick aluminum (Al) filter was employed to block the low energy photons for the spectrum measurements. The shapes in continuous and pulsed emission are the same, and the only evident difference is the input photon rate received by the spectrometer in the pulsed emission mode was one half that of the continuous mode. Thus, we used approximately twice the length of time to reach the same output photon count levels in the pulsed mode. The k-edge peaks are prominent and could be easily differentiated from the rest of the spectrum.
Fig. 13.
Output spectrum measurements for the tube in pulsed emission mode for 80 kV–130 kV in 10 kV steps.
5.4 Spatial Resolution
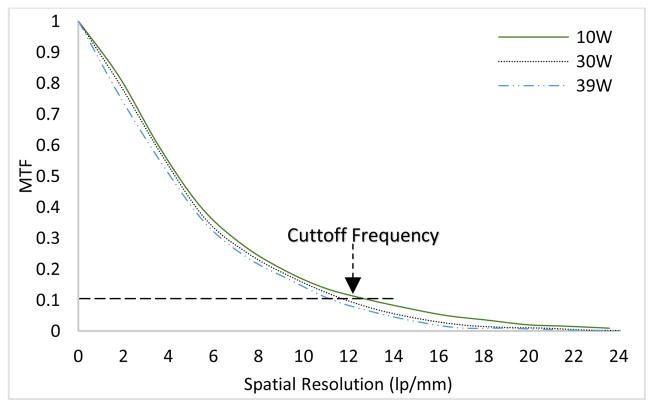
The MTF curves for 10 W, 20 W and 39 W output powers are given in Fig. 14. The cutoff frequencies (10% MTF) for 10W, 20W and 39W correspond to 13.6 lp/mm, 11.95 lp/mm, and 11.27 lp/mm, respectively. This corresponds to an improvement of 20% in the spatial resolution when the output is decreased from 39W to 10W.
Fig. 14.
The measured MTF curves for different output powers of the tube ranging from 10W to 39W.
The qualitative assessment of the spatial resolution using the bar chip phantom validates the quantitative measurements, as shown in Fig. 15. One can see that the 12 lp/mm bar lines are clearly differentiated at 39 W.
Fig. 15.
The bar chip phantom image acquired at 39W with 130kV, 300μA in the pulsed emission mode.
6. Conclusion
For the development and refinement of advanced imaging systems using the newly designed hybrid micro focus x-ray source, the first step was to characterize the performance of continuous and pulsed emission modes in projection imaging. As expected, the x-ray exposure output changes with an inverse square relationship to the distance, and linearly changes with respect to the current values. The unfiltered x-ray beam in both emission modes contains a large amount of low energy photons which are readily blocked by an aluminum (Al) filter of small thickness. This implies that these low energy photons do not contribute to the image formation and will instead be readily absorbed by the tissue/organ, adding unnecessary radiation dose. Therefore, for all the kV values, it is recommended to use a certain amount of filtration to block those unwanted low energy photons. For any fixed filter thickness at the output window of the x-ray tube, the HVL and kVs are linearly related. The wider emission angle of the x-ray beam results in high exposure output readings at the side of the central beam. There was substantial exposure output even 38 cm to the side. Lead (Pb) collimation of the field is recommended in order to make the field of coverage correspond to the imaging object size. The deviation of output kVs from the preset input values was smaller for lower kVs (40–80kV) than for higher kV values (90–130kV).
The measured focal spot sizes vary linearly with respect to the output power and match the manufacturer provided data. The focal spot sizes in the vertical direction were smaller than the horizontal direction, which was visible when comparing the spatial resolution of the MTF curves. A substantial difference in the resolution can be seen at lower frequencies when comparing the spatial resolution for the two scanning directions. We can infer that the small focal spot size in the vertical direction will have a favorable impact on the spatial resolution in the z-plane of the cone beam CTs as observed in previous studies [40, 41]. Our analysis suggests that the performance of the two emission modes was similar in terms of spatial resolution. The resolution on the bar pattern are slightly different than the one predicted by the MTF curves, due to the fact that 10% of the MTF value may not be an absolute baseline limit for the cutoff frequency estimation. Several studies have used a baseline limit of 5% for the estimation of the cutoff frequency, but we selected 10% for consistency with the majority of previous studies. Furthermore, the curve fitting algorithm used to generate the smooth LSF in the MTF calculation has a slight impact on the cutoff frequency range.
For both the continuous emission and pulsed emission modes, the characteristic peaks of the anode target in the spectrum were easily differentiated. For low input kVp’s, Lα2, Lβ4 and Lγ1 were easily differentiated, while Kα2, Kα1 and Kβ1 were differentiated for higher kVp values (80–130 kVp). Pulsed x-ray sources have shown a valuable spatial resolution improvement in breast imaging with cone beam CTs [42]. We can expect that the pulsed emission mode, when synchronized with the digital detectors in cone beam CTs and digital tomosynthesis imaging modalities, will likely improve the spatial resolution, reduce the scattering, and reduce the radiation dose levels. With valuable results drawn from this characterization, we aim to translate this hybrid x-ray source to perform advanced imaging applications like cone beam CT, digital or phase sensitive tomosynthesis in the near future.
Fig. 5.
Half value layer (HVL) and tube potential (kV) relationship for 1mm, 1.5mm and 2 mm Al filters at the tube output window.
Highlights.
A micro focus x-ray source that operates in both continuous and pulse emission modes was quantitatively characterized.
The source output, beam quality, focal spot measurements, kV accuracy, spectra analyses and spatial resolution were measured.
Our analyses revealed that both emission modes yield comparable imaging performances in terms of beam quality, spectra shape and spatial resolution.
There were no significantly large differences, thus providing the motivation for future studies to design and develop stable and robust cone beam imaging systems for various diagnostic applications.
Acknowledgments
This research was supported in part by the NIH under grant RO1CA193378, and supported in part by a grant from the University of Oklahoma Charles and Peggy Stephenson Cancer Center funded by the Oklahoma Tobacco Settlement Endowment Trust. We would like to acknowledge the support of Charles and Jean Smith Chair endowment fund as well.
Footnotes
Publisher's Disclaimer: This is a PDF file of an unedited manuscript that has been accepted for publication. As a service to our customers we are providing this early version of the manuscript. The manuscript will undergo copyediting, typesetting, and review of the resulting proof before it is published in its final citable form. Please note that during the production process errors may be discovered which could affect the content, and all legal disclaimers that apply to the journal pertain.
References
- 1.Lehmann Eberhard, et al. Non-destructive testing with neutron phase contrast imaging. Nuclear Instruments and Methods in Physics Research Section A: Accelerators, Spectrometers, Detectors and Associated Equipment. 2005;542(1):95–99. [Google Scholar]
- 2.Tafforeau P, et al. Applications of X-ray synchrotron microtomography for non-destructive 3D studies of paleontological specimens. Applied Physics A. 2006;83(2):195–202. [Google Scholar]
- 3.Zeitler J Axel, Gladden Lynn F. In-vitro tomography and non-destructive imaging at depth of pharmaceutical solid dosage forms. European Journal of Pharmaceutics and Biopharmaceutics. 2009;71(1):2–22. doi: 10.1016/j.ejpb.2008.08.012. [DOI] [PubMed] [Google Scholar]
- 4.Malhotra V Mohan, Carino Nicholas J. Handbook on Nondestructive Testing of Concrete. 2. CRC press; 2003. [Google Scholar]
- 5.Schambach Sebastian J, et al. Application of micro-CT in small animal imaging. Methods. 2010;50(1):2–13. doi: 10.1016/j.ymeth.2009.08.007. [DOI] [PubMed] [Google Scholar]
- 6.Umetani Keiji, et al. Synchrotron radiation microimaging in rabbit models of cancer for preclinical testing. Nuclear Instruments and Methods in Physics Research Section A: Accelerators, Spectrometers, Detectors and Associated Equipment. 2009;609(1):38–49. [Google Scholar]
- 7.Kim Jae-Hun, et al. Quantitative dynamic contrast-enhanced MRI for mouse models using automatic detection of the arterial input function. NMR in Biomedicine. 2012;25(4):674–684. doi: 10.1002/nbm.1784. [DOI] [PubMed] [Google Scholar]
- 8.Broisat Alexis, et al. Nanobodies targeting mouse/human VCAM1 for the nuclear imaging of atherosclerotic lesions. Circulation research. 2012;110(7):927–937. doi: 10.1161/CIRCRESAHA.112.265140. [DOI] [PMC free article] [PubMed] [Google Scholar]
- 9.Luedemann Wolf, et al. Direct magnification technique for cerebral angiography in the rat. Investigative radiology. 1998;33(7):421–424. doi: 10.1097/00004424-199807000-00008. [DOI] [PubMed] [Google Scholar]
- 10.Jorgensen Steven M, Demirkaya Omer, Ritman Erik L. Three-dimensional imaging of vasculature and parenchyma in intact rodent organs with X-ray micro-CT. American Journal of Physiology-Heart and Circulatory Physiology. 1998;275(3):H1103–H1114. doi: 10.1152/ajpheart.1998.275.3.H1103. [DOI] [PubMed] [Google Scholar]
- 11.Wan Shu-Yen, et al. Extraction of the hepatic vasculature in rats using 3-D micro-CT images. IEEE transactions on medical imaging. 2000;19(9):964–971. doi: 10.1109/42.887843. [DOI] [PubMed] [Google Scholar]
- 12.Goldfeder Sarah, Davis Delphine, Cullinan Jeanne. Breast specimen radiography: can it predict margin status of excised breast carcinoma? Academic radiology. 2006;13(12):1453–1459. doi: 10.1016/j.acra.2006.08.017. [DOI] [PubMed] [Google Scholar]
- 13.Ouandji Fabrice, et al. Characterization of a CCD-based digital x-ray imaging system for small-animal studies: properties of spatial resolution. Applied optics. 2002;41(13):2420–2427. doi: 10.1364/ao.41.002420. [DOI] [PubMed] [Google Scholar]
- 14.Donnelly Edwin F, et al. Characterization of the phase-contrast radiography edge-enhancement effect in a cabinet x-ray system. Physics in medicine and biology. 2005;51(1):21. doi: 10.1088/0031-9155/51/1/002. [DOI] [PubMed] [Google Scholar]
- 15.Powles-Glover N, et al. Comparison of Faxitron™ versus MicroCT imaging of the skeleton of the suckling rat. Reproductive Toxicology. 2014;48:44–50. doi: 10.1016/j.reprotox.2014.05.001. [DOI] [PubMed] [Google Scholar]
- 16.Lewis RA. Medical phase contrast x-ray imaging: current status and future prospects. Physics in medicine and biology. 2004;49(16):3573. doi: 10.1088/0031-9155/49/16/005. [DOI] [PubMed] [Google Scholar]
- 17.Pogany A, Gao D, Wilkins SW. Contrast and resolution in imaging with a microfocus x-ray source. Review of Scientific Instruments. 1997;68(7):2774–2782. [Google Scholar]
- 18.Wilkins SW, Gureyev TE, Gao D, Pogany A, Stevenson AW. Phase-contrast imaging using polychromatic hard X-rays. Nature. 1996;384(6607):335–338. [Google Scholar]
- 19.Mandel Leonard, Wolf Emil. Optical coherence and quantum optics. Cambridge university press; 1995. [Google Scholar]
- 20.Wu Xizeng, Liu Hong. Clarification of aspects in in-line phase-sensitive x-ray imaging. Medical Physics. 2007;3(2):737–743. doi: 10.1118/1.2431475. [DOI] [PubMed] [Google Scholar]
- 21.Mayo Sheridan C, Stevenson Andrew W, Wilkins Stephen W. In-line phase-contrast X-ray imaging and tomography for materials science. Materials. 2012;5(5):937–965. doi: 10.3390/ma5050937. [DOI] [PMC free article] [PubMed] [Google Scholar]
- 22.Zhang Da, et al. Preliminary feasibility study of an in-line phase contrast x-ray imaging prototype. IEEE Transactions on Biomedical Engineering. 2008;55(9):2249–2257. doi: 10.1109/TBME.2008.919136. [DOI] [PubMed] [Google Scholar]
- 23.Bravin Alberto, Coan Paola, Suortti Pekka. X-ray phase-contrast imaging: from pre-clinical applications towards clinics. Physics in medicine and biology. 2012;58(1):R1. doi: 10.1088/0031-9155/58/1/R1. [DOI] [PubMed] [Google Scholar]
- 24.Castriconi Roberta, Mettivier Giovanni, Russo Paolo. International Workshop on Digital Mammography. Springer International Publishing; 2016. Image Quality and Radiation Dose in Propagation Based Phase Contrast Mammography with a Microfocus X-ray Tube: A Phantom Study; pp. 618–624. [Google Scholar]
- 25.Wong Molly Donovan, Yan Aimin, Ghani Muhammad, Li Yuhua, Fajardo Laurie, Wu Xizeng, Liu Hong. Dose and detectability improvements with high energy phase sensitive x-ray imaging in comparison to low energy conventional imaging. Physics in medicine and biology. 2014;59(9):N37. doi: 10.1088/0031-9155/59/9/N37. [DOI] [PMC free article] [PubMed] [Google Scholar]
- 26.Ghani Muhammad U, Yan Aimin, Wong Molly D, Li Yuhua, Ren Liqiang, Wu Xizeng, Liu Hong. Low dose high energy x-ray in-line phase sensitive imaging prototype: Investigation of optimal geometric conditions and design parameters. Journal of X-ray science and technology. 2015;23(6):667–682. doi: 10.3233/XST-150519. [DOI] [PMC free article] [PubMed] [Google Scholar]
- 27.Diemoz Paul C, Bravin Alberto, Sztrókay-Gaul Anikó, Ruat Marie, Grandl Susanne, Mayr Doris, Auweter Sigrid, et al. A method for high-energy, low-dose mammography using edge illumination x-ray phase-contrast imaging. Physics in Medicine and Biology. 2016;61(24):8750. doi: 10.1088/1361-6560/61/24/8750. [DOI] [PubMed] [Google Scholar]
- 28.Guan Huifeng, Xu Qiaofeng, Garson Alfred B, III, Anastasio Mark A. Boundary-enhancement in propagation-based x-ray phase-contrast tomosynthesis improves depth position characterization. Physics in medicine and biology. 2015;60(8):N151. doi: 10.1088/0031-9155/60/8/N151. [DOI] [PubMed] [Google Scholar]
- 29.Lewis RA, Yagi Naoto, Kitchen MJ, Morgan MJ, Paganin David, Siu KKW, Pavlov Konstantin, et al. Dynamic imaging of the lungs using x-ray phase contrast. Physics in medicine and biology. 2005;50(21):5031. doi: 10.1088/0031-9155/50/21/006. [DOI] [PubMed] [Google Scholar]
- 30.Wu Di, Yan Aimin, Li Yuhua, Wong Molly D, Zheng Bin, Wu Xizeng, Liu Hong. Characterization of a high-energy in-line phase contrast tomosynthesis prototype. Medical physics. 2015;42(5):2404–2420. doi: 10.1118/1.4917227. [DOI] [PMC free article] [PubMed] [Google Scholar]
- 31.American Association of Physicists in Medicine. Protocols for the radiation safety surveys of diagnostic radiological equipment. AAPM Report. 1988;25 [Google Scholar]
- 32.Ma C-M, et al. AAPM protocol for 40–300 kV x-ray beam dosimetry in radiotherapy and radiobiology. Medical physics. 2001;28(6):868–893. doi: 10.1118/1.1374247. [DOI] [PubMed] [Google Scholar]
- 33.Shepard S Jeff, et al. An exposure indicator for digital radiography: AAPM Task Group 116 (executive summary) Medical physics. 2009;36(7):2898–2914. doi: 10.1118/1.3121505. [DOI] [PMC free article] [PubMed] [Google Scholar]
- 34.American Association of Physicists in Medicine. Equipment requirements and quality control for mammography. New York: American Institute of Physics, Report. 1990;29 [Google Scholar]
- 35.Everson Jeffrey D, Gray JE. Focal-spot measurement: comparison of slit, pinhole, and star resolution pattern techniques. Radiology. 1987;165(1):261–264. doi: 10.1148/radiology.165.1.3628780. [DOI] [PubMed] [Google Scholar]
- 36.Rong Xiujiang J, et al. Measurement of focal spot size with slit camera using computed radiography and flat-panel based digital detectors. Medical physics. 2003;30(7):1768–1775. doi: 10.1118/1.1579583. [DOI] [PubMed] [Google Scholar]
- 37.Fujita Hiroshi, et al. A simple method for determining the modulation transfer function in digital radiography. IEEE Transactions on medical imaging. 1992;11(1):34–39. doi: 10.1109/42.126908. [DOI] [PubMed] [Google Scholar]
- 38.Dobbins James T, III, et al. DQE (f) of four generations of computed radiography acquisition devices. Medical physics. 1995;22(10):1581–1593. doi: 10.1118/1.597627. [DOI] [PubMed] [Google Scholar]
- 39.Zhang Da, Liu Hong, Wu Xizeng. DQE analysis on a dual detector phase x-ray imaging system. Physics in medicine and biology. 2008;53(18):5165. doi: 10.1088/0031-9155/53/18/021. [DOI] [PubMed] [Google Scholar]
- 40.Kwan Alexander LC, et al. Evaluation of the spatial resolution characteristics of a cone-beam breast CT scanner. Medical physics. 2007;34(1):275–281. doi: 10.1118/1.2400830. [DOI] [PubMed] [Google Scholar]
- 41.Ghani Muhammad U, et al. Investigation of spatial resolution characteristics of an in vivo microcomputed tomography system. Nuclear Instruments and Methods in Physics Research Section A: Accelerators, Spectrometers, Detectors and Associated Equipment. 2016;807:129–136. doi: 10.1016/j.nima.2015.11.007. [DOI] [PMC free article] [PubMed] [Google Scholar]
- 42.Gazi Peymon M, et al. Evolution of spatial resolution in breast CT at UC Davis. Medical physics. 2015;42(4):1973–1981. doi: 10.1118/1.4915079. [DOI] [PMC free article] [PubMed] [Google Scholar]


