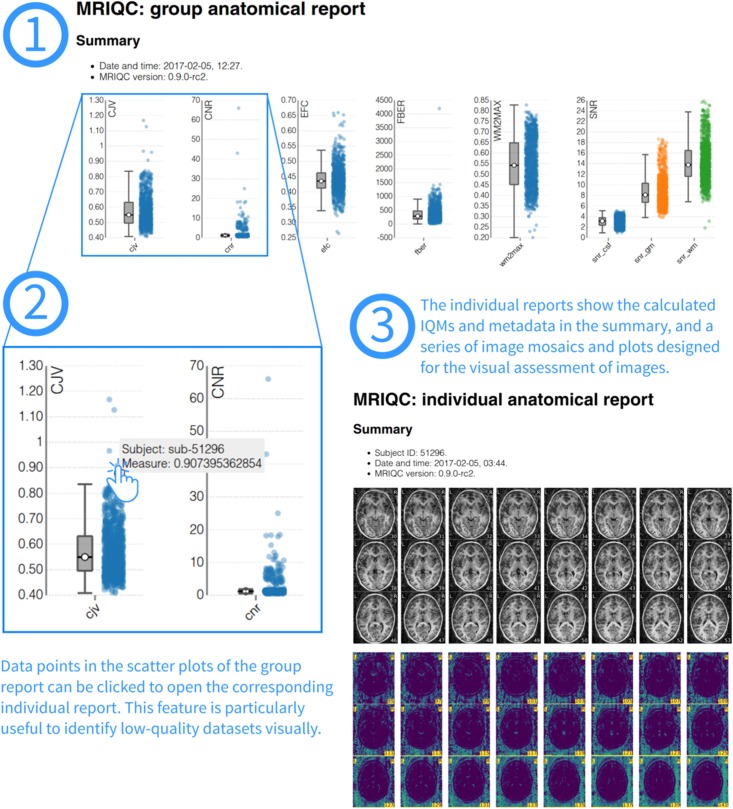
Fig 5. Visual reports.
MRIQC generates one individual report per subject in the input folder and one group report including all subjects. To visually assess MRI samples, the first step (1) is opening the group report. This report shows boxplots and strip-plots for each of the IQMs. Looking at the distribution, it is possible to find images that potentially show low-quality as they are generally reflected as outliers in one or more strip-plots. For instance, in (2) hovering a suspicious sample within the coefficient of joint variation (CJV) plot, the subject identifier is presented (“sub-51296”). Clicking on that sample will open the individual report for that specific subject (3). This particular example of individual report is available online at https://web.stanford.edu/group/poldracklab/mriqc/reports/sub-51296_T1w.html.

