
FIGURE 3.
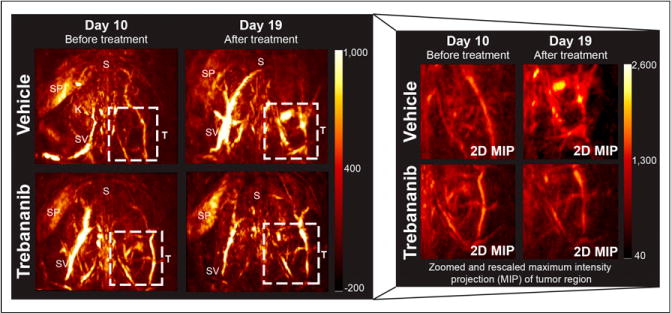
PAT displays changes in tumor vasculature induced by trebananib treatment. Both images of full mouse torso (2 × 2 cm) and zoomed 2-dimensional maximum-intensity projection (MIP) focused on tumor ROI (T) are shown. Top of images point toward head of mouse. K = kidneys; S = spine; SP = spleen; SV = superficial vessels.