
FIGURE 6.
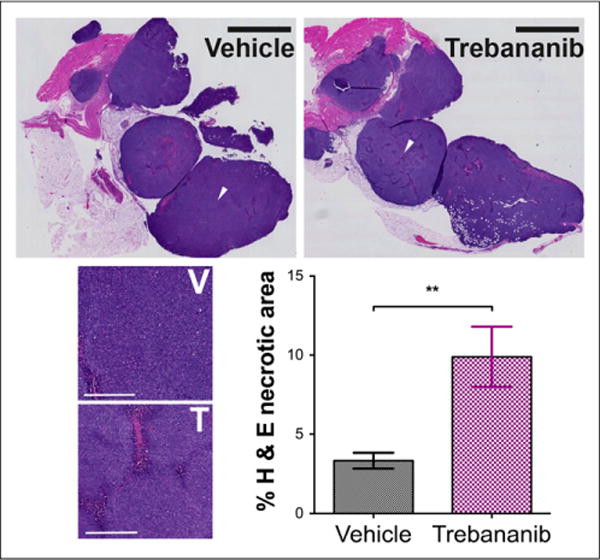
Hematoxylin and eosin (H&E) staining. Tumor cell death was more than 2-fold higher in trebananib-treated group. Scale bar was 2.5 mm whole field (black bar) and 400 urn in zoomed sections (white bar) at location of white arrows in whole field. **P < 0.01. T = trebananib; V = vehicle.