Figure 11.

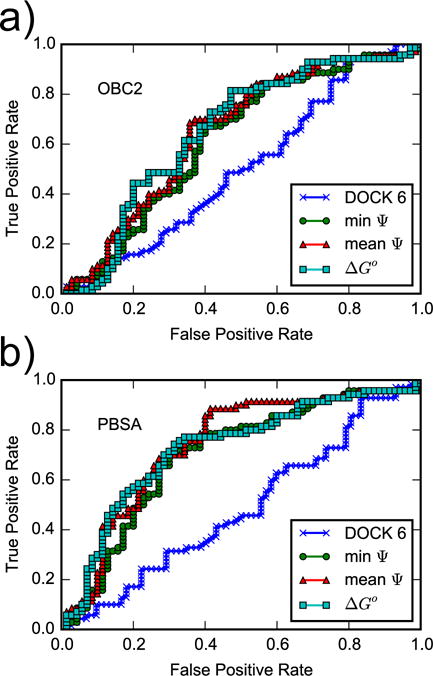
ROC curves for the DOCK 6 score and for AlGDock scores calculated using the (a) OBC2 or (b) PBSA implicit solvent models. Snapshots from YANK simulations with active ligands are weighted according to scheme (c).

ROC curves for the DOCK 6 score and for AlGDock scores calculated using the (a) OBC2 or (b) PBSA implicit solvent models. Snapshots from YANK simulations with active ligands are weighted according to scheme (c).